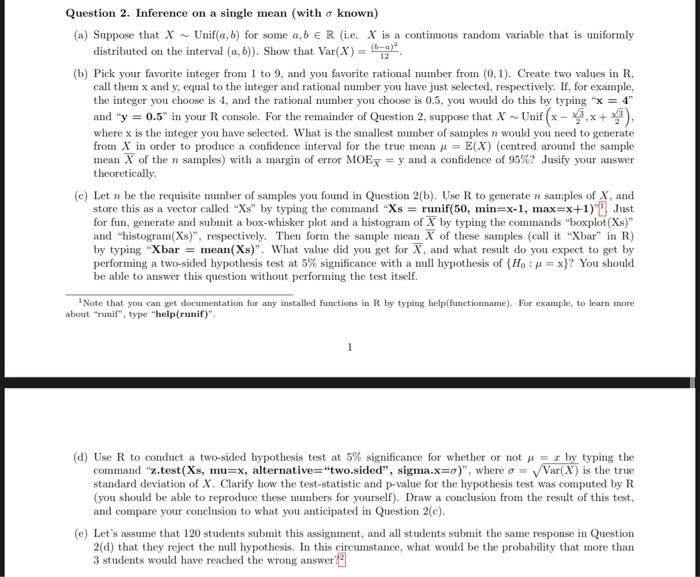
Question 2. Inference on a single mean (with known) (a) Suppose that XUnif(a,b) for some a,bR (i.e. X is a continuous random variable that is uniformly distributed on the interval (a,b)). Show that Var(X)=12(ba)2. (b) Pick your favorite integer from 1 to 9 , and you favorite rational number from (0,1). Create two values in R, call them x and y, equal to the integer and rational number you have just selected, respectively. If, for example, the integer you choose is 4 , and the rational number you choose is 0.5, you would do this by typing " x=4 " and " y=0.5 " in your R console. For the remainder of Question 2 , suppose that X Unif (x23,x+23), where x is the integer you have selected. What is the smallest number of samples n would you need to generate from X in order to produce a confidence interval for the true mean =E(X) (centred around the sample mean X of the n samples) with a margin of error MOE X=y and a confidence of 95% ? Jusify your answer theoretically. (c) Let n be the requisite number of samples you found in Question 2(b). Use R to generate n samples of X, and store this as a vector called "X Xs " by typing the command "Xs =runif(50,min=x1,max=x+1)[1] J Jst for fun, generate and submit a box-whisker plot and a histogram of X by typing the commands "boxplot(Xs)" and "histogram(Xs)", respectively. Then form the sample mean X of these samples (call it "Xbar" in R ) by typing "Xbar = mean(Xs)". What value did you get for X, and what result do you expect to get by performing a two-sided hypothesis test at 5% significance with a null hypothesis of {H0:=x} ? You should be able to answer this question without performing the test itself. 1 Note that you can get documentation for any installed functions in R by typing help(functionname). For example, to learn more about "runif", type "help(runif)". (d) Use R to conduct a two-sided hypothesis test at 5% significance for whether or not =x by typing the command "z.test(Xs, mu =x, alternative = "two.sided", sigma. X=)", where =Var(X) is the true standard deviation of X. Clarify how the test-statistic and p-value for the hypothesis test was computed by R (you should be able to reproduce these numbers for yourself). Draw a conclusion from the result of this test, and compare your conclusion to what you anticipated in Question 2(c). (e) Let's assume that 120 students submit this assignment, and all students submit the same response in Question 2 (d) that they reject the null hypothesis. In this circumstance, what would be the probability that more than 3 students would have reached the wrong


