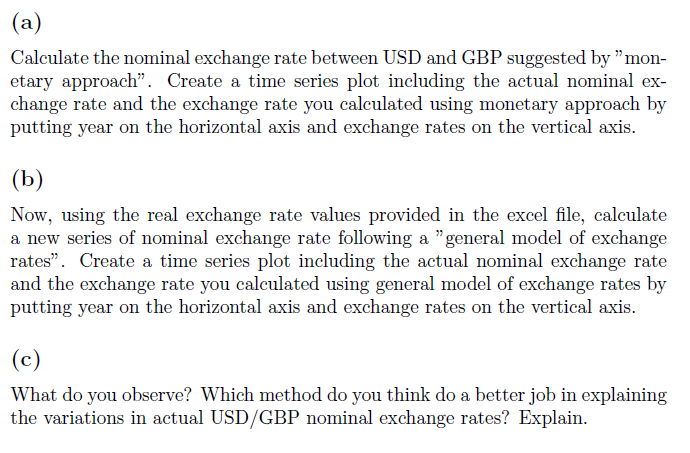
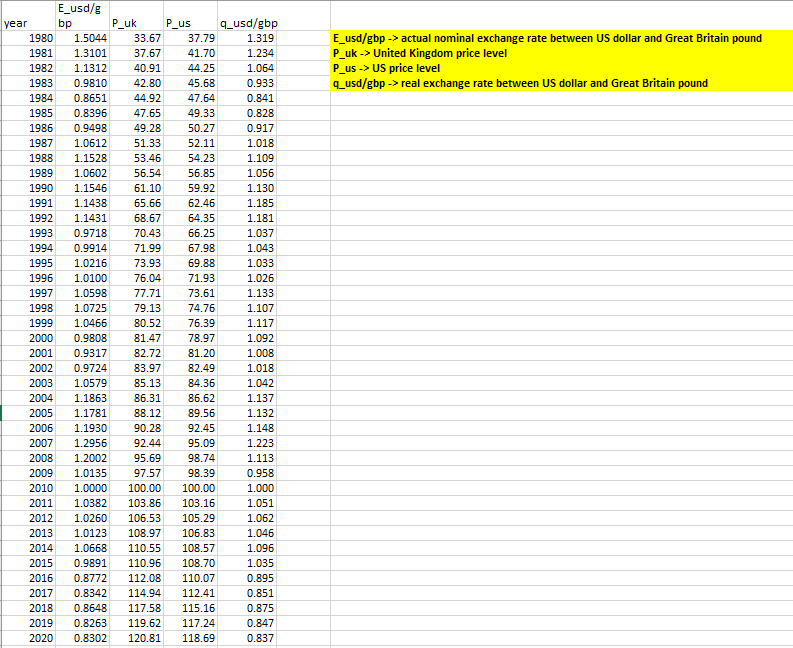
Question 2 The Excel workbook titled 'nominal exrate.xlsx' contains the data set on the ac- tual nominal exchange rate between US Dollar and Great Britain Pound (GBP) as well as the price levels in both countries and the real exchange rate between USD and GBP for the period between 1980 and 2020. (a) Calculate the nominal exchange rate between USD and GBP suggested by mon- etary approach. Create a time series plot including the actual nominal ex- change rate and the exchange rate you calculated using monetary approach by putting year on the horizontal axis and exchange rates on the vertical axis. (b) Now, using the real exchange rate values provided in the excel file, calculate a new series of nominal exchange rate following a "general model of exchange rates. Create a time series plot including the actual nominal exchange rate and the exchange rate you calculated using general model of exchange rates by putting year on the horizontal axis and exchange rates on the vertical axis. (c) What do you observe? Which method do you think do a better job in explaining the variations in actual USD/GBP nominal exchange rates? Explain. E_usd/gbp -> actual nominal exchange rate between US dollar and Great Britain pound P_uk -> United Kingdom price level P_us -> US price level q_usd/gbp -> real exchange rate between US dollar and Great Britain pound E_usd/g year bp 1980 1.5044 1981 1.3101 1982 1.1312 1983 0.9810 1984 0.8651 1985 0.8396 1986 0.9498 1987 1.0612 1988 1.1528 1989 1.0602 1990 1.1546 1991 1.1438 1992 1.1431 1993 0.9718 1994 0.9914 1995 1.0216 1996 1.0100 1997 1.0598 1998 1.0725 1999 1.0466 2000 0.9808 2001 0.9317 2002 0.9724 2003 1.0579 2004 1.1863 2005 1.1781 2006 1.1930 2007 1.2956 2008 1.2002 2009 1.0135 2010 1.0000 2011 1.0382 2012 1.0260 2013 1.0123 2014 1.0668 2015 0.9891 2016 0.8772 2017 0.8342 2018 0.8648 2019 0.8263 2020 0.8302 P_uk P_us 33.67 37.79 37.67 41.70 40.91 44.25 42.80 45.68 44.92 47.64 47.65 49.33 49.28 50.27 51.33 52.11 53.46 54.23 56.54 56.85 61.10 59.92 65.66 62.46 68.67 64.35 70.43 66.25 71.99 67.98 73.93 69.88 76.04 71.93 77.71 73.61 79.13 74.76 80.52 76.39 81.47 78.97 82.72 81.20 83.97 82.49 85.13 84.36 86.31 86.62 88.12 89.56 90.28 92.45 92.44 95.09 95.69 98.74 97.57 98.39 100.00 100.00 103.86 103.16 106.53 105.29 108.97 106.83 110.55 108.57 110.96 108.70 112.08 110.07 114.94 112.41 117.58 115.16 119.62 117.24 120.81 118.69 q_usd/gbp 1.319 1.234 1.064 0.933 0.841 0.828 0.917 1.018 1.109 1.056 1.130 1.185 1.181 1.037 1.043 1.033 1.026 1.133 1.107 1.117 1.092 1.008 1.018 1.042 1.137 1.132 1.148 1.223 1.113 0.958 1.000 1.051 1.062 1.046 1.096 1.035 0.895 0.851 0.875 0.847 0.837 Question 2 The Excel workbook titled 'nominal exrate.xlsx' contains the data set on the ac- tual nominal exchange rate between US Dollar and Great Britain Pound (GBP) as well as the price levels in both countries and the real exchange rate between USD and GBP for the period between 1980 and 2020. (a) Calculate the nominal exchange rate between USD and GBP suggested by mon- etary approach. Create a time series plot including the actual nominal ex- change rate and the exchange rate you calculated using monetary approach by putting year on the horizontal axis and exchange rates on the vertical axis. (b) Now, using the real exchange rate values provided in the excel file, calculate a new series of nominal exchange rate following a "general model of exchange rates. Create a time series plot including the actual nominal exchange rate and the exchange rate you calculated using general model of exchange rates by putting year on the horizontal axis and exchange rates on the vertical axis. (c) What do you observe? Which method do you think do a better job in explaining the variations in actual USD/GBP nominal exchange rates? Explain. E_usd/gbp -> actual nominal exchange rate between US dollar and Great Britain pound P_uk -> United Kingdom price level P_us -> US price level q_usd/gbp -> real exchange rate between US dollar and Great Britain pound E_usd/g year bp 1980 1.5044 1981 1.3101 1982 1.1312 1983 0.9810 1984 0.8651 1985 0.8396 1986 0.9498 1987 1.0612 1988 1.1528 1989 1.0602 1990 1.1546 1991 1.1438 1992 1.1431 1993 0.9718 1994 0.9914 1995 1.0216 1996 1.0100 1997 1.0598 1998 1.0725 1999 1.0466 2000 0.9808 2001 0.9317 2002 0.9724 2003 1.0579 2004 1.1863 2005 1.1781 2006 1.1930 2007 1.2956 2008 1.2002 2009 1.0135 2010 1.0000 2011 1.0382 2012 1.0260 2013 1.0123 2014 1.0668 2015 0.9891 2016 0.8772 2017 0.8342 2018 0.8648 2019 0.8263 2020 0.8302 P_uk P_us 33.67 37.79 37.67 41.70 40.91 44.25 42.80 45.68 44.92 47.64 47.65 49.33 49.28 50.27 51.33 52.11 53.46 54.23 56.54 56.85 61.10 59.92 65.66 62.46 68.67 64.35 70.43 66.25 71.99 67.98 73.93 69.88 76.04 71.93 77.71 73.61 79.13 74.76 80.52 76.39 81.47 78.97 82.72 81.20 83.97 82.49 85.13 84.36 86.31 86.62 88.12 89.56 90.28 92.45 92.44 95.09 95.69 98.74 97.57 98.39 100.00 100.00 103.86 103.16 106.53 105.29 108.97 106.83 110.55 108.57 110.96 108.70 112.08 110.07 114.94 112.41 117.58 115.16 119.62 117.24 120.81 118.69 q_usd/gbp 1.319 1.234 1.064 0.933 0.841 0.828 0.917 1.018 1.109 1.056 1.130 1.185 1.181 1.037 1.043 1.033 1.026 1.133 1.107 1.117 1.092 1.008 1.018 1.042 1.137 1.132 1.148 1.223 1.113 0.958 1.000 1.051 1.062 1.046 1.096 1.035 0.895 0.851 0.875 0.847 0.837