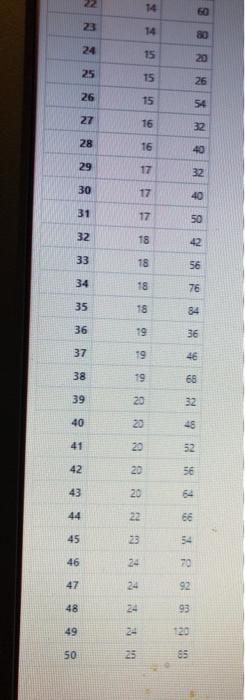
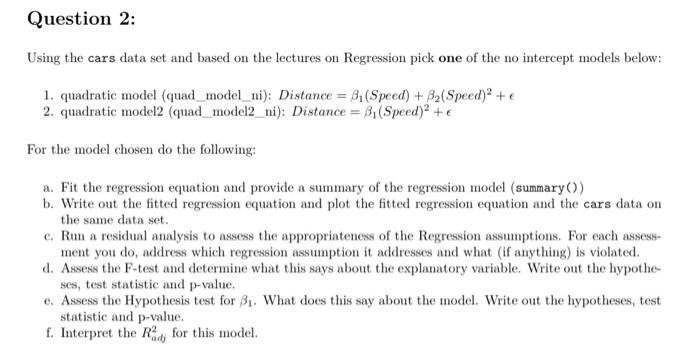
Question 2: Using the cars data set and based on the lectures on Regression pick one of the no intercept models below: 1. quadratic model (quad_model_ni): Distance = 3(Speed) + Ba(Speed)? + 2. quadratic model2 (quad_model2_ni): Distance = 8(Speed)? + For the model chosen do the following: a. Fit the regression equation and provide a summary of the regression model rummary) b. Write out the fitted regression equation and plot the fitted regression equation and the cars data on the same data set c. Run a residual analysis to assess the appropriateness of the Regression assumptions. For each assess ment you do, address which regression assumption it addresses and what (if anything) is violated d. Assess the F-test and determine what this says about the explanatory variable. Write out the hypothe- ses, test statistic and p-value. e. Assess the Hypothesis test for B1. What does this may about the model. Write out the hypotheses, test statistic and p-value. f. Interpret the Rs for this model RStudio de Edit Code O View Plots Session Build Debug Probike toch Help Go to function - Air- Sound O di ter paths est 1 2 2 1 2 B 6 10 10 11 11 12 12 13 12 14 15 12 12 13 RE 19 13 20 21 22 09 24 11 23 25 15 2 13 54 7 2 CT 29 10 31 JE Come 14 600 23 14 80 24 15 20 25 15 26 26 15 54 27 16 28 16 40 29 17 32 30 17 40 31 17 50 32 18 42 33 18 56 34 18 76 35 18 84 36 19 36 37 19 46. 38 19 68 39 20 32 40 20 48 41 20 52 42 20 SE 43 20 64 44 22 66 45 23 54 46 24 0 47 24 92 48 93 49 120 50 25 85 Showing 20 to 50 of 50 entries 2 total columns Console 13 ORI Studio File Edit Session Untitled Somelo speed 1 4 No N 4 5 6 8 15 3 14 - 23 14 80 24 15 20 25 15 26 26 15 54 27 16 32 28 16 40 29 17 32 30 17 40 31 17 50 32 18 33 18 56 34 76 18 8 35 84 36 19 36 37 19 46 38 GIF 68 39 20 32 40 20 46 41 20 52 42 56 43 20 44 22 66 45 23 54 46 24 47 24 92 48 24 93 49 120 50 25 S5 Question 2: Using the cars data set and based on the lectures on Regression pick one of the no intercept models below: 1. quadratic model (quad model_ni): Distance = B (Speed) +32(Speed) + 2. quadratic model2 (quad_model2_ni): Distance = 3,(Speed)2 + For the model chosen do the following: a. Fit the regression equation and provide a summary of the regression model (summary()) b. Write out the fitted regression equation and plot the fitted regression equation and the cars data on the same data set. c. Run a residual analysis to assess the appropriateness of the Regression assumptions. For each assess- ment you do, address which regression assumption it addresses and what (if anything) is violated. d. Assess the F-test and determine what this says about the explanatory variable. Write out the hypothe ses, test statistic and p-value. e. Assess the Hypothesis test for 81. What does this say about the model. Write out the hypotheses, test statistic and p-value. f. Interpret the Rady for this model