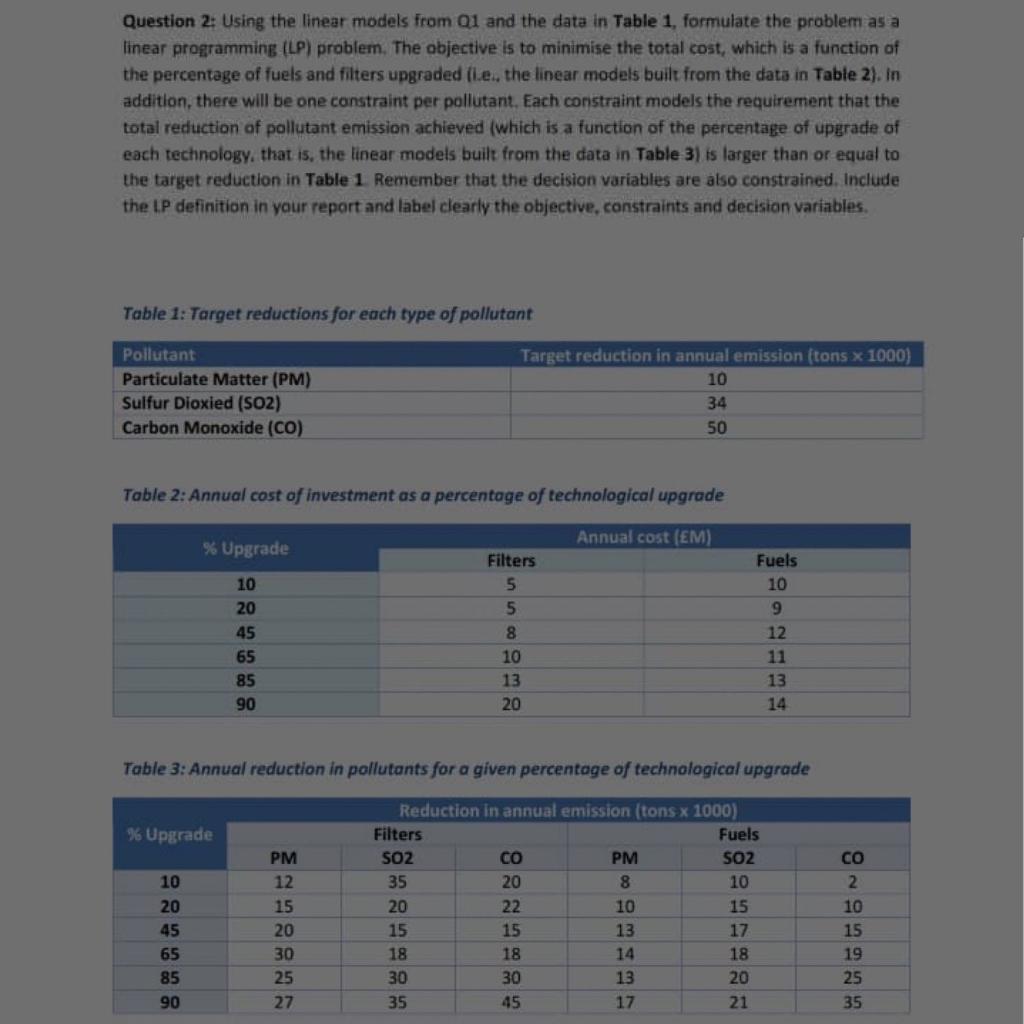
Question 2: Using the linear models from Q1 and the data in Table 1, formulate the problem as a linear programming (LP) problem. The objective is to minimise the total cost, which is a function of the percentage of fuels and filters upgraded (i.e. the linear models built from the data in Table 2). In addition, there will be one constraint per pollutant. Each constraint models the requirement that the total reduction of pollutant emission achieved (which is a function of the percentage of upgrade of each technology that is, the linear models built from the data in Table 3) is larger than or equal to the target reduction in Table 1. Remember that the decision variables are also constrained. Include the LP definition in your report and label clearly the objective, constraints and decision variables. Table 1: Target reductions for each type of pollutant Pollutant Particulate Matter (PM) Sulfur Dioxied (S02) Carbon Monoxide (CO) Target reduction in annual emission (tons x 1000) 10 34 50 Table 2: Annual cost of investment as a percentage of technological upgrade Annual cost (EM) % Upgrade Filters 5 Fuels 10 10 20 5 9 12 45 8 10 65 11 13 85 13 20 90 14 Table 3: Annual reduction in pollutants for a given percentage of technological upgrade % Upgrade 10 20 45 65 85 90 PM 12 15 20 30 25 27 Reduction in annual emission (tons x 1000) Filters Fuels SOZ CO PM SOZ 35 20 8 10 20 22 10 15 15 15 13 17 18 18 14 18 30 30 13 20 35 45 17 21 CO 2 10 15 19 25 35 Question 2: Using the linear models from Q1 and the data in Table 1, formulate the problem as a linear programming (LP) problem. The objective is to minimise the total cost, which is a function of the percentage of fuels and filters upgraded (i.e. the linear models built from the data in Table 2). In addition, there will be one constraint per pollutant. Each constraint models the requirement that the total reduction of pollutant emission achieved (which is a function of the percentage of upgrade of each technology that is, the linear models built from the data in Table 3) is larger than or equal to the target reduction in Table 1. Remember that the decision variables are also constrained. Include the LP definition in your report and label clearly the objective, constraints and decision variables. Table 1: Target reductions for each type of pollutant Pollutant Particulate Matter (PM) Sulfur Dioxied (S02) Carbon Monoxide (CO) Target reduction in annual emission (tons x 1000) 10 34 50 Table 2: Annual cost of investment as a percentage of technological upgrade Annual cost (EM) % Upgrade Filters 5 Fuels 10 10 20 5 9 12 45 8 10 65 11 13 85 13 20 90 14 Table 3: Annual reduction in pollutants for a given percentage of technological upgrade % Upgrade 10 20 45 65 85 90 PM 12 15 20 30 25 27 Reduction in annual emission (tons x 1000) Filters Fuels SOZ CO PM SOZ 35 20 8 10 20 22 10 15 15 15 13 17 18 18 14 18 30 30 13 20 35 45 17 21 CO 2 10 15 19 25 35