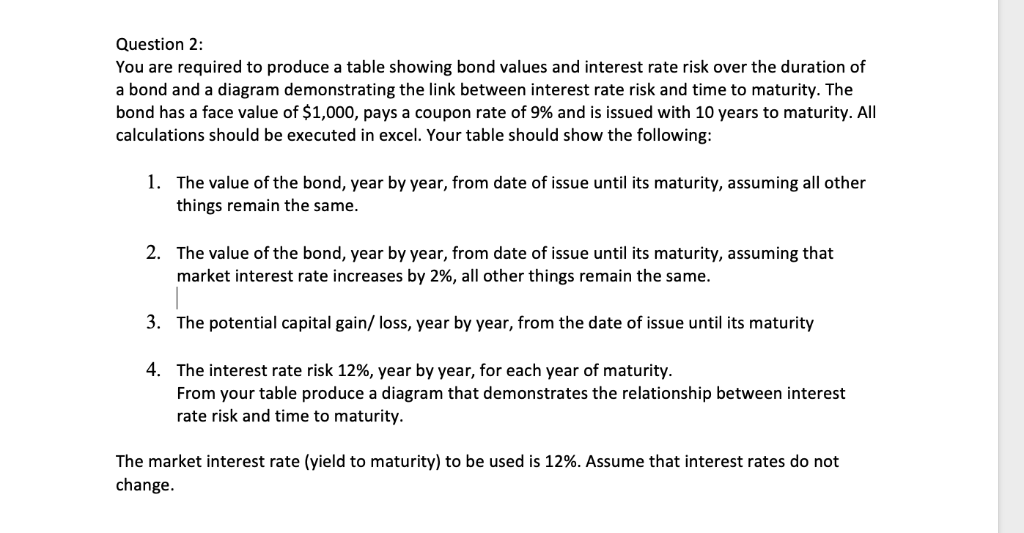
Question 2: You are required to produce a table showing bond values and interest rate risk over the duration of a bond and a diagram demonstrating the link between interest rate risk and time to maturity. The bond has a face value of $1,000, pays a coupon rate of 9% and is issued with 10 years to maturity. All calculations should be executed in excel. Your table should show the following: 1. The value of the bond, year by year, from date of issue until its maturity, assuming all other things remain the same. 2. The value of the bond, year by year, from date of issue until its maturity, assuming that market interest rate increases by 2%, all other things remain the same. 3. The potential capital gain/ loss, year by year, from the date of issue until its maturity 4. The interest rate risk 12%, year by year, for each year of maturity. From your table produce a diagram that demonstrates the relationship between interest rate risk and time to maturity. The market interest rate (yield to maturity) to be used is 12%. Assume that interest rates do not change Question 2: You are required to produce a table showing bond values and interest rate risk over the duration of a bond and a diagram demonstrating the link between interest rate risk and time to maturity. The bond has a face value of $1,000, pays a coupon rate of 9% and is issued with 10 years to maturity. All calculations should be executed in excel. Your table should show the following: 1. The value of the bond, year by year, from date of issue until its maturity, assuming all other things remain the same. 2. The value of the bond, year by year, from date of issue until its maturity, assuming that market interest rate increases by 2%, all other things remain the same. 3. The potential capital gain/ loss, year by year, from the date of issue until its maturity 4. The interest rate risk 12%, year by year, for each year of maturity. From your table produce a diagram that demonstrates the relationship between interest rate risk and time to maturity. The market interest rate (yield to maturity) to be used is 12%. Assume that interest rates do not change


