Answered step by step
Verified Expert Solution
Link Copied!

Question

1 Approved Answer

Question 20 4 pts We are interested in the relationship between mid-term exam scores and final exam scores. The Final Exam score is the dependent
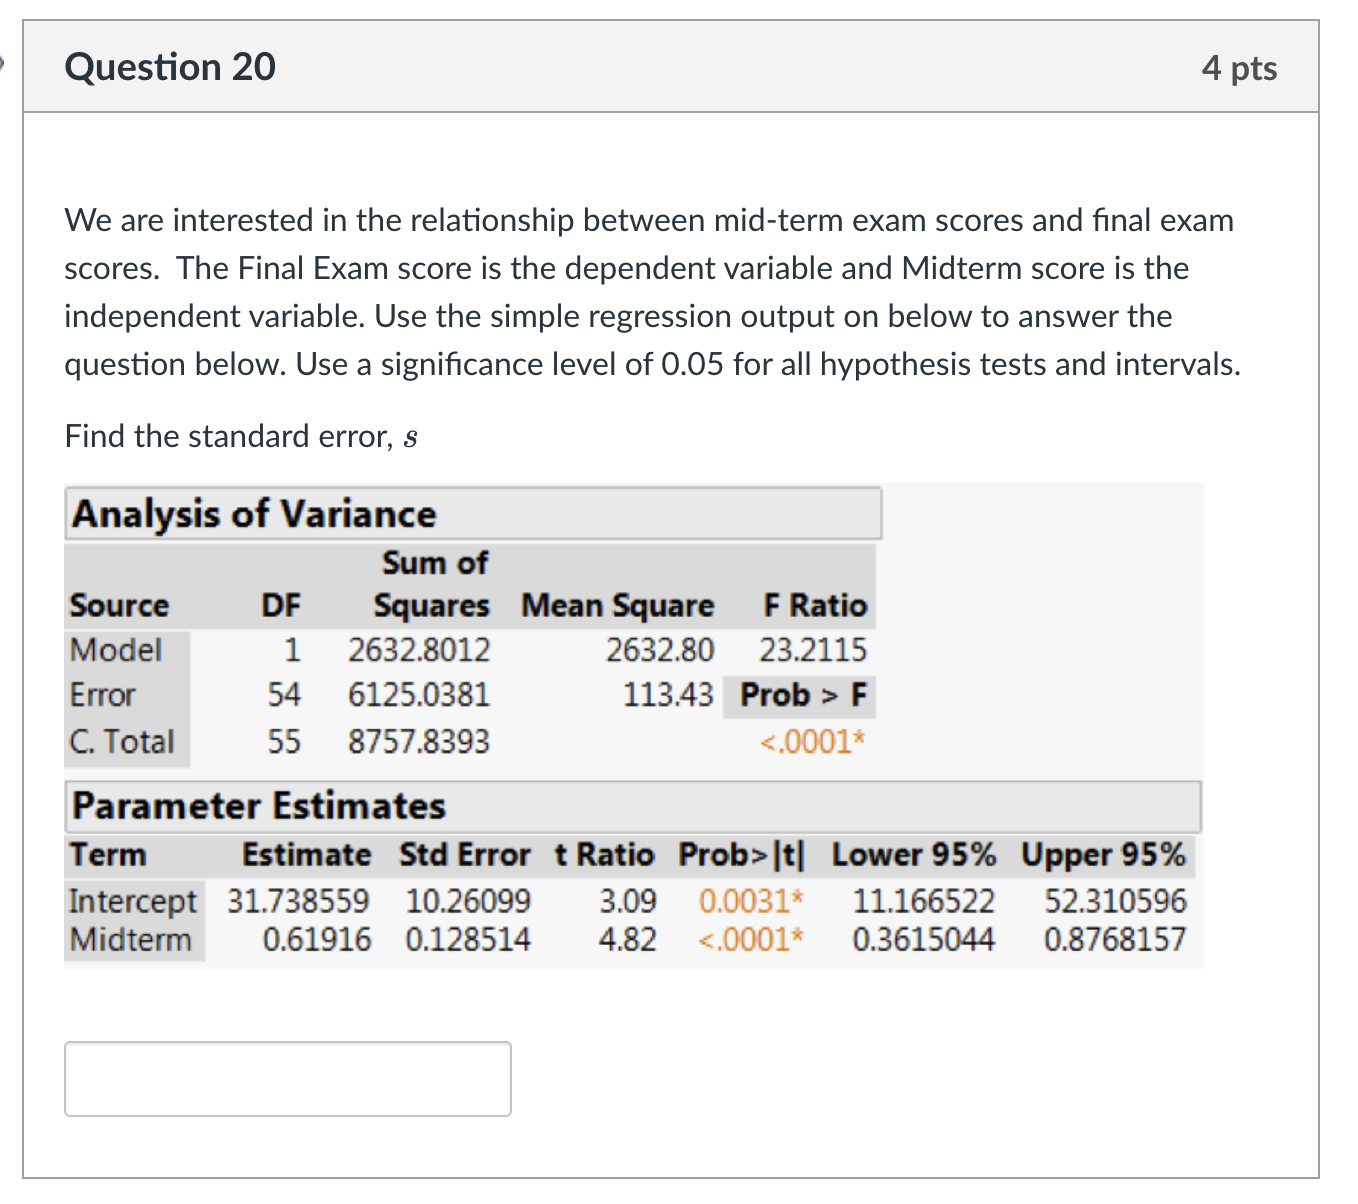
image text in transcribed
Question 20 4 pts We are interested in the relationship between mid-term exam scores and final exam scores. The Final Exam score is the dependent variable and Midterm score is the independent variable. Use the simple regression output on below to answer the question below. Use a significance level of 0.05 for all hypothesis tests and intervals. Find the standard error, s Analysis of Variance Sum of Source DF Squares Mean Square F Ratio Model 1 2632.8012 2632.80 23.2115 Error 54 6125.0381 113.43 Prob > F C. Total 55 8757.8393 <.0001 parameter estimates term estimate std error t ratio prob>|t| Lower 95% Upper 95% Intercept 31.738559 10.26099 3.09 0.0031* 11.166522 52.310596 Midterm 0.61916 0.128514 4.82 <.0001>

Step by Step Solution

There are 3 Steps involved in it

Step: 1

blur-text-image

Get Instant Access to Expert-Tailored Solutions

See step-by-step solutions with expert insights and AI powered tools for academic success

Step: 2

blur-text-image

Step: 3

blur-text-image

Ace Your Homework with AI

Get the answers you need in no time with our AI-driven, step-by-step assistance

Get Started

Recommended Textbook for

Probability and Random Processes With Applications to Signal Processing and Communications

Authors: Scott Miller, Donald Childers

2nd edition

123869811, 978-0121726515, 121726517, 978-0130200716, 978-0123869814

More Books

Students also viewed these Mathematics questions