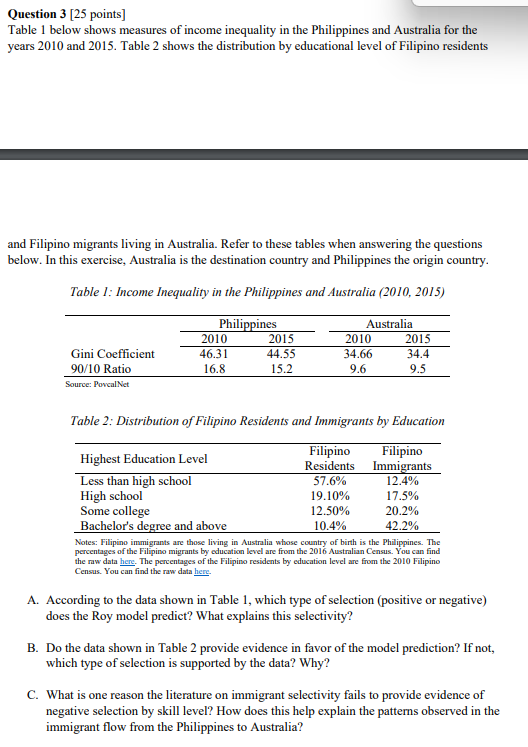
Question 3 [25 points] Table 1 below shows measures of income inequality in the Philippines and Australia for the years 2010 and 2015. Table 2 shows the distribution by educational level of Filipino residents and Filipino migrants living in Australia. Refer to these tables when answering the questions below. In this exercise, Australia is the destination country and Philippines the origin country. Table 1: Income Inequality in the Philippines and Australia (2010, 2015) Gini Coefficient 90/10 Ratio Source: PovcalNet Philippines 2010 2015 46.31 44.55 16.8 15.2 Australia 2010 2015 34.66 34.4 9.6 9.5 Table 2: Distribution of Filipino Residents and Immigrants by Education Filipino Filipino Highest Education Level Residents Immigrants Less than high school 57.6% 12.4% High school 19.10% 17.5% Some college 12.50% 20.2% Bachelor's degree and above 10.4% 42.2% Notes: Filipino immigrants are those living in Australia whose country of birth is the Philippines. The percentages of the Filipino migrants by education level are from the 2016 Australian Census. You can find the raw data here. The percentages of the Filipino residents by education level are from the 2010 Filipino Census. You can find the raw data here A. According to the data shown in Table 1, which type of selection (positive or negative) does the Roy model predict? What explains this selectivity? B. Do the data shown in Table 2 provide evidence in favor of the model prediction? If not, which type of selection is supported by the data? Why? C. What is one reason the literature on immigrant selectivity fails to provide evidence of negative selection by skill level? How does this help explain the patterns observed in the immigrant flow from the Philippines to Australia? Question 3 [25 points] Table 1 below shows measures of income inequality in the Philippines and Australia for the years 2010 and 2015. Table 2 shows the distribution by educational level of Filipino residents and Filipino migrants living in Australia. Refer to these tables when answering the questions below. In this exercise, Australia is the destination country and Philippines the origin country. Table 1: Income Inequality in the Philippines and Australia (2010, 2015) Gini Coefficient 90/10 Ratio Source: PovcalNet Philippines 2010 2015 46.31 44.55 16.8 15.2 Australia 2010 2015 34.66 34.4 9.6 9.5 Table 2: Distribution of Filipino Residents and Immigrants by Education Filipino Filipino Highest Education Level Residents Immigrants Less than high school 57.6% 12.4% High school 19.10% 17.5% Some college 12.50% 20.2% Bachelor's degree and above 10.4% 42.2% Notes: Filipino immigrants are those living in Australia whose country of birth is the Philippines. The percentages of the Filipino migrants by education level are from the 2016 Australian Census. You can find the raw data here. The percentages of the Filipino residents by education level are from the 2010 Filipino Census. You can find the raw data here A. According to the data shown in Table 1, which type of selection (positive or negative) does the Roy model predict? What explains this selectivity? B. Do the data shown in Table 2 provide evidence in favor of the model prediction? If not, which type of selection is supported by the data? Why? C. What is one reason the literature on immigrant selectivity fails to provide evidence of negative selection by skill level? How does this help explain the patterns observed in the immigrant flow from the Philippines to Australia


