Answered step by step
Verified Expert Solution
Link Copied!

Question

1 Approved Answer

Question 3: Economic (mathematical) model (a) The relationship between annual salary (salary) and the number of previous years of labor market experience (exper) is described
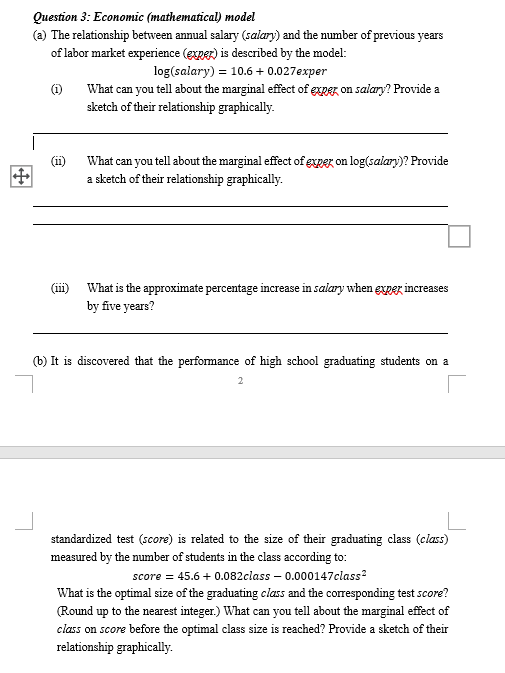
image text in transcribed

Question 3: Economic (mathematical) model (a) The relationship between annual salary (salary) and the number of previous years of labor market experience (exper) is described by the model: log(salary)=10.6+0.027exper (i) What can you tell about the marginal effect of exper on salory? Provide a sketch of their relationship graphically. (ii) What can you tell about the marginal effect of exper on log (salary)? Provide a sketch of their relationship graphically. (iii) What is the approximate percentage increase in salary when exper increases by five years? (b) It is discovered that the performance of high school graduating students on a standardized test (score) is related to the size of their graduating class (class) measured by the number of students in the class according to: score=45.6+0.082class0.000147class2 What is the optimal size of the graduating class and the corresponding test score? (Round up to the nearest integer.) What can you tell about the marginal effect of class on score before the optimal class size is reached? Provide a sketch of their relationship graphically. Question 3: Economic (mathematical) model (a) The relationship between annual salary (salary) and the number of previous years of labor market experience (exper) is described by the model: log(salary)=10.6+0.027exper (i) What can you tell about the marginal effect of exper on salory? Provide a sketch of their relationship graphically. (ii) What can you tell about the marginal effect of exper on log (salary)? Provide a sketch of their relationship graphically. (iii) What is the approximate percentage increase in salary when exper increases by five years? (b) It is discovered that the performance of high school graduating students on a standardized test (score) is related to the size of their graduating class (class) measured by the number of students in the class according to: score=45.6+0.082class0.000147class2 What is the optimal size of the graduating class and the corresponding test score? (Round up to the nearest integer.) What can you tell about the marginal effect of class on score before the optimal class size is reached? Provide a sketch of their relationship graphically

Step by Step Solution

There are 3 Steps involved in it

Step: 1

blur-text-image

Get Instant Access to Expert-Tailored Solutions

See step-by-step solutions with expert insights and AI powered tools for academic success

Step: 2

blur-text-image

Step: 3

blur-text-image

Ace Your Homework with AI

Get the answers you need in no time with our AI-driven, step-by-step assistance

Get Started

Students also viewed these Accounting questions

Question

List behaviors to improve effective leadership in meetings

Answered: 1 week ago