

Answered step by step
Verified Expert Solution
Question
1 Approved Answer
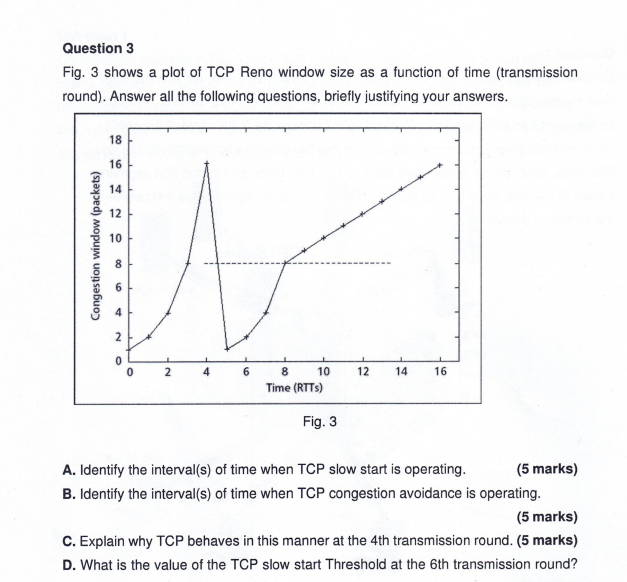
Question 3 Fig. 3 shows a plot of TCP Reno window size as a function of time ( transmission round ) . Answer all the
Question
Fig. shows a plot of TCP Reno window size as a function of time transmission
round Answer all the following questions, briefly justifying your answers.
Fig.
A Identify the intervals of time when TCP slow start is operating.
B Identify the intervals of time when TCP congestion avoidance is operating.
C Explain why TCP behaves in this manner at the th transmission round. marks
D What is the value of the TCP slow start Threshold at the th transmission round?
Step by Step Solution
There are 3 Steps involved in it
Step: 1

Get Instant Access to Expert-Tailored Solutions
See step-by-step solutions with expert insights and AI powered tools for academic success
Step: 2

Step: 3
Ace Your Homework with AI
Get the answers you need in no time with our AI-driven, step-by-step assistance
Get Started
Practical Neo4j
Authors: Gregory Jordan
1st Edition
1484200225, 9781484200223