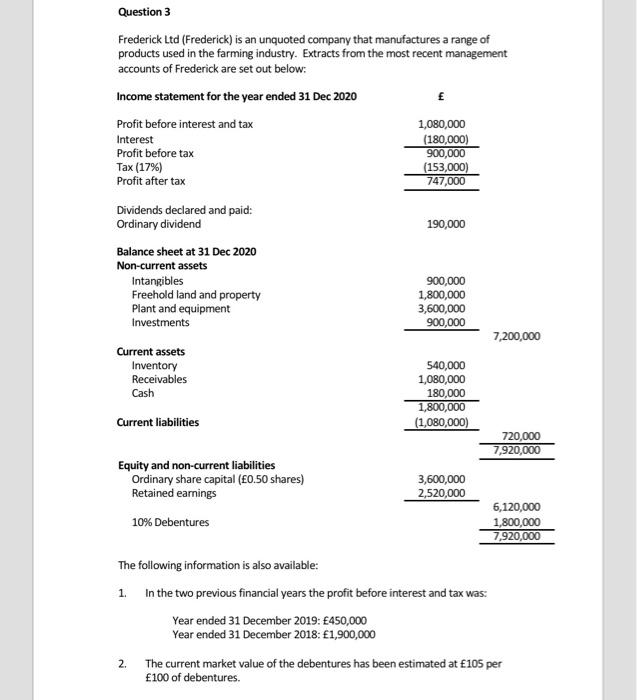
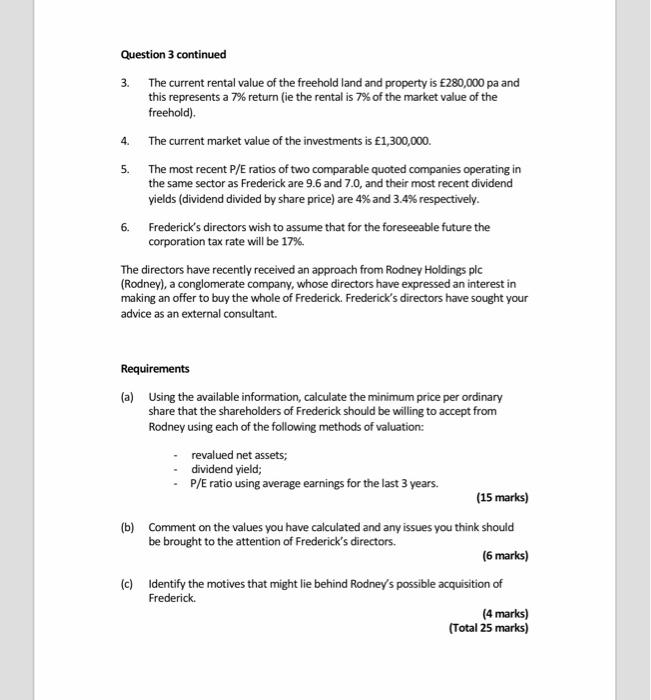
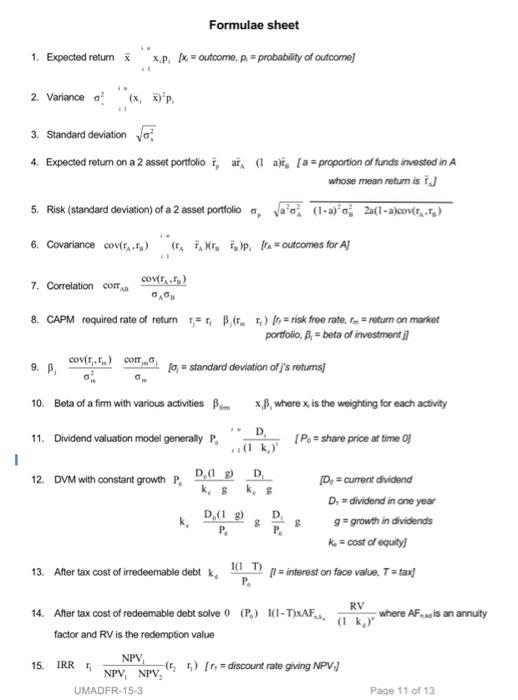
Question 3 Frederick Ltd (Frederick) is an unquoted company that manufactures a range of products used in the farming industry. Extracts from the most recent management accounts of Frederick are set out below: Income statement for the year ended 31 Dec 2020 Profit before interest and tax 1,080,000 Interest (180,000) Profit before tax 900,000 Tax (17%) (153,000) Profit after tax 747,000 Dividends declared and paid: Ordinary dividend 190,000 Balance sheet at 31 Dec 2020 Non-current assets Intangibles 900,000 Freehold land and property 1,800,000 Plant and equipment 3,600,000 Investments 900,000 7,200,000 Current assets Inventory 540,000 Receivables 1,080,000 Cash 180,000 1,800,000 Current liabilities (1,080,000) 720,000 7,920,000 Equity and non-current liabilities Ordinary share capital (0.50 shares) 3,600,000 Retained earnings 2,520,000 6,120,000 10% Debentures 1,800,000 7,920,000 The following information is also available: 1. In the two previous financial years the profit before interest and tax was. Year ended 31 December 2019: 450,000 Year ended 31 December 2018: 1,900,000 The current market value of the debentures has been estimated at 105 per 100 of debentures. 2. 4. 5. Question 3 continued 3. The current rental value of the freehold land and property is E280,000 pa and this represents a 7% return (ie the rental is 7% of the market value of the freehold) The current market value of the investments is 1,300,000. The most recent P/E ratios of two comparable quoted companies operating in the same sector as Frederick are 9.6 and 7.0, and their most recent dividend yields (dividend divided by share price) are 4% and 3.4% respectively. 6. Frederick's directors wish to assume that for the foreseeable future the corporation tax rate will be 17%. The directors have recently received an approach from Rodney Holdings plc (Rodney), a conglomerate company, whose directors have expressed an interest in making an offer to buy the whole of Frederick. Frederick's directors have sought your advice as an external consultant. Requirements (a) Using the available information, calculate the minimum price per ordinary share that the shareholders of Frederick should be willing to accept from Rodney using each of the following methods of valuation: revalued net assets; dividend yield; P/E ratio using average earnings for the last 3 years. (15 marks) (b) Comment on the values you have calculated and any issues you think should be brought to the attention of Frederick's directors. (6 marks) (c) Identify the motives that might lie behind Rodney's possible acquisition of Frederick. (4 marks) (Total 25 marks) APPENDIX Present value tables Present value of 1 in n years at discount rater Periods Discount rate (r) (n) 1% 2% % 7% 8% 9 10% 1 2 3 1 2 3 4 5 6 7 8 9 10 0.990 0.980 0.971 0.962 0.952 0.943 0.935 0.926 0.917 0.909 0.980 0.961 0.943 0.925 0.907 0.890 0.873 0.857 0.842 0.826 0.971 0.942 0,915 0.889 0.864 0.840 0.816 0.794 0.772 0.751 0.961 0.924 0.888 0.855 0.823 0.792 0.763 0.735 0.708 0.683 0.951 0.906 0.863 0.822 0.784 0.747 0.713 0.681 0.650 0.621 0.942 0.888 0.837 0.790 0.746 0.705 0.666 0.630 0.596 0.564 0.933 0.871 0.813 0.760 0.711 0.665 0.623 0.583 0.547 0.513 0.923 0.853 0.789 0.731 0.677 0.627 0.582 0.540 0.502 0.467 0.914 0.837 0.766 0.703 0.645 0.592 0.544 0.500 0.460 0.424 0.905 0.820 0.744 0.676 0.614 0.558 0.508 0.463 0.422 0.386 0.896 0.804 0.722 0.650 0.585 0.527 0.475 0.429 0.388 0.350 0.887 0.788 0.701 0.625 0.557 0.497 0.444 0.397 0.356 0319 0.879 0.773 0.681 0.601 0.530 0.469 0.415 0.368 0.326 0.290 0.870 0.758 0.661 0.577 0.505 0.442 0.388 0.340 0.299 0.263 0.861 0.743 0.642 0.555 0.481 0.417 0.362 0.315 0.275 0.239 5 6 7 8 9 10 12 13 14 15 12 13 14 15 11% 12% 13% 15% 16% 17% 18% 19% 20% 1 2 3 4 5 6 7 8 9 10 11 12 13 14 15 0.901 0.893 0.885 0.877 0.870 0.862 0.855 0.847 0.840 0.833 0.812 0.797 0.783 0.769 0.756 0.743 0.731 0.7180.706 0.694 0.731 0.712 0.693 0.675 0.658 0.641 0.624 0.609 0.593 0.579 0.659 0.636 0.613 0.592 0.572 0.552 0.534 0.516 0.499 0.482 0.593 0.567 0.543 0.519 0.497 0.476 0.456 0.437 0.419 0.402 0.535 0.507 0.480 0.456 0.432 0.410 0.390 0.370 0352 0.335 0.482 0.452 0.425 0.400 0.376 0.354 0.333 0.314 0.296 0.279 0.434 0.404 0.376 0.351 0.327 0.305 0.285 0.266 0.249 0.233 0.391 0.361 0.333 0.308 0.284 0.263 0.243 0.225 0.209 0.194 0.352 0.322 0.295 0.270 0.247 0.227 0.208 0.191 0.176 0.162 0.317 0.287 0.261 0.237 0.215 0.195 0.178 0.162 0.148 0.135 0.286 0.257 0.231 0.208 0.187 0.168 0.152 0.137 0.124 0.112 0.258 0.229 0.204 0.182 0.163 0.145 0.130 0.116 0.104 0.093 0.232 0.205 0.181 0.160 0.141 0.125 0.111 0.099 0.088 0.078 0.209 0.183 0.160 0.140 0.123 0.108 0.095 0.084 0.074 0.065 4 5 6 7 8 9 10 11 12 13 14 15 Annuity tables Present value of l receivable at the end of each year for n years at discount rater Periods Discount rate (1) 1% 2% 3% 4% 5% 7% 8% 9% 10% 1 2 3 4 5 6 7 8 9 10 11 12 13 0.990 0.980 0.971 0.962 0.952 0.943 0.935 0.926 0.917 1.970 1.942 1.913 1.886 1.859 1.833 1.808 1.783 1.759 2.941 2.884 2.829 2.775 2.723 2.673 2.624 2.577 2.531 3.902 3.808 3.717 3.630 3.546 3.465 3.387 3.312 3.240 4.853 4.713 4.580 4.452 4.329 4.212 4.100 3.993 3.890 5.795 5.601 5.417 5.242 5.076 4.917 4.767 4.623 4.486 6.728 6.472 6.230 6.002 5.786 5.582 5.389 5.206 5.033 7.652 7.325 7.020 6.733 6.463 6.210 5.971 5.747 5.535 8.566 8.162 7.786 7.435 7.108 6.802 6.515 6.247 5.995 9.471 8.983 8.530 8.111 7.722 7.360 7.024 6.710 6.418 10.368 9.787 9.253 8.760 8.306 7.887 7.499 7.139 6.805 11.255 10.575 9.954 9.385 8.863 8.384 7.943 7.536 7.161 12.134 11.348 10.635 9.986 9.394 8.853 8.358 7.904 7.487 13.004 12.106 11.296 10.563 9.899 9.295 8.745 8.244 7.786 13.865 12.849 11.938 11.118 10.380 9.712 9.108 8.559 8.061 0.909 1.736 2.487 3.170 3.791 4.355 4.868 5.335 5.759 6.145 6.495 6,814 7.103 7.367 7.606 1 2 3 4 5 6 7 8 9 10 11 12 13 14 15 15 11% 12% 13% 14% 15% 16% 17% 18% 19% 20% 1 2 3 4 6 7 8 9 10 11 12 13 14 0.901 0.893 1.713 1.690 2.444 2.402 3.102 3.037 3.696 3.605 4.231 4.111 4.712 4.564 5.146 4.968 5.537 5.328 5.889 5.650 6.207 5.938 6.492 6.194 6.750 6.424 6.982 6.618 7.191 6.811 0.885 0.877 1.668 1.647 2.361 2.322 2.974 2.914 3.517 3.433 3.998 3.889 4.423 4.288 4.799 4.639 5.132 4.946 5.426 5.216 5.687 5.453 5.918 5.660 6.122 5.842 6.302 6.002 6.462 6.142 0.870 1.626 2.283 2.855 3.352 3.784 4.160 4.487 4.772 5.019 5.234 5.421 5.583 5.724 5.847 0.862 0.855 0.847 0.840 1.605 1.585 1.566 1.547 2.246 2.210 2.174 2.140 2.798 2.743 2.690 2.639 3.274 3.199 3.127 3.058 3.685 3.589 3.498 3.410 4.039 3.922 3.812 3.706 4.344 4.207 4.078 3.954 4.607 4.451 4.303 4.163 4.833 4.659 4.494 4.339 5.029 4.836 4.656 4.486 5.197 4.988 4.793 4.611 5.342 5.118 4.910 4.715 5.468 5.229 5.008 4.802 5.575 5.324 5.092 4.876 0.833 1.528 2.106 2.589 2.991 3.326 3.605 3.837 4.031 4.192 4.327 4.439 4.533 4.611 4.675 1 2 3 4 5 6 7 8 9 10 11 12 13 14 15 Formulae sheet 1. Expected retum xp Ix outcome, p = probability of outcome) 1 2. Variance of 3. Standard deviation of 4. Expected retur on a 2 asset portfolio i, ai, ai, [a= proportion of funds invested in A whose mean retumis ij 5. Risk (standard deviation) of a 2 asset portfolio , vao (1-a) o 23(1-2)covit..ta) 6. Covariance coven) (MP [ta= outcomes for Aj CO2 7. Correlation con 8. CAPM required rate of return = r, B,(r. 1) In = risk free rate, tm = retum an market portfolio. B = beta of investment cov,) com 10 = standard deviation of j's retums 10. Beta of a firm with various activities B x, where x is the weighting for each activity D 11. Dividend valuation model generally P, IP = share price at time of D 12. DVM with constant growth P. D.01 ) D.(1 ) P & D P D. = current dividend D. = dividend in ne year 9- growth in dividends k = cost of equity] = interest on face value. T=tax] 13. After tax cost of irredeemable debtk (1 T) P 14. After tax cost of redeemable debt solve 0 (P) (I-TXAF. RV (I k.) where AF is an annuity factor and RV is the redemption value NPV NPV, NPV) Irdiscount rate giving NPV) UMADFR-15-3 Page 11 of 13 15. IRR Question 3 Frederick Ltd (Frederick) is an unquoted company that manufactures a range of products used in the farming industry. Extracts from the most recent management accounts of Frederick are set out below: Income statement for the year ended 31 Dec 2020 Profit before interest and tax 1,080,000 Interest (180,000) Profit before tax 900,000 Tax (17%) (153,000) Profit after tax 747,000 Dividends declared and paid: Ordinary dividend 190,000 Balance sheet at 31 Dec 2020 Non-current assets Intangibles 900,000 Freehold land and property 1,800,000 Plant and equipment 3,600,000 Investments 900,000 7,200,000 Current assets Inventory 540,000 Receivables 1,080,000 Cash 180,000 1,800,000 Current liabilities (1,080,000) 720,000 7,920,000 Equity and non-current liabilities Ordinary share capital (0.50 shares) 3,600,000 Retained earnings 2,520,000 6,120,000 10% Debentures 1,800,000 7,920,000 The following information is also available: 1. In the two previous financial years the profit before interest and tax was. Year ended 31 December 2019: 450,000 Year ended 31 December 2018: 1,900,000 The current market value of the debentures has been estimated at 105 per 100 of debentures. 2. 4. 5. Question 3 continued 3. The current rental value of the freehold land and property is E280,000 pa and this represents a 7% return (ie the rental is 7% of the market value of the freehold) The current market value of the investments is 1,300,000. The most recent P/E ratios of two comparable quoted companies operating in the same sector as Frederick are 9.6 and 7.0, and their most recent dividend yields (dividend divided by share price) are 4% and 3.4% respectively. 6. Frederick's directors wish to assume that for the foreseeable future the corporation tax rate will be 17%. The directors have recently received an approach from Rodney Holdings plc (Rodney), a conglomerate company, whose directors have expressed an interest in making an offer to buy the whole of Frederick. Frederick's directors have sought your advice as an external consultant. Requirements (a) Using the available information, calculate the minimum price per ordinary share that the shareholders of Frederick should be willing to accept from Rodney using each of the following methods of valuation: revalued net assets; dividend yield; P/E ratio using average earnings for the last 3 years. (15 marks) (b) Comment on the values you have calculated and any issues you think should be brought to the attention of Frederick's directors. (6 marks) (c) Identify the motives that might lie behind Rodney's possible acquisition of Frederick. (4 marks) (Total 25 marks) APPENDIX Present value tables Present value of 1 in n years at discount rater Periods Discount rate (r) (n) 1% 2% % 7% 8% 9 10% 1 2 3 1 2 3 4 5 6 7 8 9 10 0.990 0.980 0.971 0.962 0.952 0.943 0.935 0.926 0.917 0.909 0.980 0.961 0.943 0.925 0.907 0.890 0.873 0.857 0.842 0.826 0.971 0.942 0,915 0.889 0.864 0.840 0.816 0.794 0.772 0.751 0.961 0.924 0.888 0.855 0.823 0.792 0.763 0.735 0.708 0.683 0.951 0.906 0.863 0.822 0.784 0.747 0.713 0.681 0.650 0.621 0.942 0.888 0.837 0.790 0.746 0.705 0.666 0.630 0.596 0.564 0.933 0.871 0.813 0.760 0.711 0.665 0.623 0.583 0.547 0.513 0.923 0.853 0.789 0.731 0.677 0.627 0.582 0.540 0.502 0.467 0.914 0.837 0.766 0.703 0.645 0.592 0.544 0.500 0.460 0.424 0.905 0.820 0.744 0.676 0.614 0.558 0.508 0.463 0.422 0.386 0.896 0.804 0.722 0.650 0.585 0.527 0.475 0.429 0.388 0.350 0.887 0.788 0.701 0.625 0.557 0.497 0.444 0.397 0.356 0319 0.879 0.773 0.681 0.601 0.530 0.469 0.415 0.368 0.326 0.290 0.870 0.758 0.661 0.577 0.505 0.442 0.388 0.340 0.299 0.263 0.861 0.743 0.642 0.555 0.481 0.417 0.362 0.315 0.275 0.239 5 6 7 8 9 10 12 13 14 15 12 13 14 15 11% 12% 13% 15% 16% 17% 18% 19% 20% 1 2 3 4 5 6 7 8 9 10 11 12 13 14 15 0.901 0.893 0.885 0.877 0.870 0.862 0.855 0.847 0.840 0.833 0.812 0.797 0.783 0.769 0.756 0.743 0.731 0.7180.706 0.694 0.731 0.712 0.693 0.675 0.658 0.641 0.624 0.609 0.593 0.579 0.659 0.636 0.613 0.592 0.572 0.552 0.534 0.516 0.499 0.482 0.593 0.567 0.543 0.519 0.497 0.476 0.456 0.437 0.419 0.402 0.535 0.507 0.480 0.456 0.432 0.410 0.390 0.370 0352 0.335 0.482 0.452 0.425 0.400 0.376 0.354 0.333 0.314 0.296 0.279 0.434 0.404 0.376 0.351 0.327 0.305 0.285 0.266 0.249 0.233 0.391 0.361 0.333 0.308 0.284 0.263 0.243 0.225 0.209 0.194 0.352 0.322 0.295 0.270 0.247 0.227 0.208 0.191 0.176 0.162 0.317 0.287 0.261 0.237 0.215 0.195 0.178 0.162 0.148 0.135 0.286 0.257 0.231 0.208 0.187 0.168 0.152 0.137 0.124 0.112 0.258 0.229 0.204 0.182 0.163 0.145 0.130 0.116 0.104 0.093 0.232 0.205 0.181 0.160 0.141 0.125 0.111 0.099 0.088 0.078 0.209 0.183 0.160 0.140 0.123 0.108 0.095 0.084 0.074 0.065 4 5 6 7 8 9 10 11 12 13 14 15 Annuity tables Present value of l receivable at the end of each year for n years at discount rater Periods Discount rate (1) 1% 2% 3% 4% 5% 7% 8% 9% 10% 1 2 3 4 5 6 7 8 9 10 11 12 13 0.990 0.980 0.971 0.962 0.952 0.943 0.935 0.926 0.917 1.970 1.942 1.913 1.886 1.859 1.833 1.808 1.783 1.759 2.941 2.884 2.829 2.775 2.723 2.673 2.624 2.577 2.531 3.902 3.808 3.717 3.630 3.546 3.465 3.387 3.312 3.240 4.853 4.713 4.580 4.452 4.329 4.212 4.100 3.993 3.890 5.795 5.601 5.417 5.242 5.076 4.917 4.767 4.623 4.486 6.728 6.472 6.230 6.002 5.786 5.582 5.389 5.206 5.033 7.652 7.325 7.020 6.733 6.463 6.210 5.971 5.747 5.535 8.566 8.162 7.786 7.435 7.108 6.802 6.515 6.247 5.995 9.471 8.983 8.530 8.111 7.722 7.360 7.024 6.710 6.418 10.368 9.787 9.253 8.760 8.306 7.887 7.499 7.139 6.805 11.255 10.575 9.954 9.385 8.863 8.384 7.943 7.536 7.161 12.134 11.348 10.635 9.986 9.394 8.853 8.358 7.904 7.487 13.004 12.106 11.296 10.563 9.899 9.295 8.745 8.244 7.786 13.865 12.849 11.938 11.118 10.380 9.712 9.108 8.559 8.061 0.909 1.736 2.487 3.170 3.791 4.355 4.868 5.335 5.759 6.145 6.495 6,814 7.103 7.367 7.606 1 2 3 4 5 6 7 8 9 10 11 12 13 14 15 15 11% 12% 13% 14% 15% 16% 17% 18% 19% 20% 1 2 3 4 6 7 8 9 10 11 12 13 14 0.901 0.893 1.713 1.690 2.444 2.402 3.102 3.037 3.696 3.605 4.231 4.111 4.712 4.564 5.146 4.968 5.537 5.328 5.889 5.650 6.207 5.938 6.492 6.194 6.750 6.424 6.982 6.618 7.191 6.811 0.885 0.877 1.668 1.647 2.361 2.322 2.974 2.914 3.517 3.433 3.998 3.889 4.423 4.288 4.799 4.639 5.132 4.946 5.426 5.216 5.687 5.453 5.918 5.660 6.122 5.842 6.302 6.002 6.462 6.142 0.870 1.626 2.283 2.855 3.352 3.784 4.160 4.487 4.772 5.019 5.234 5.421 5.583 5.724 5.847 0.862 0.855 0.847 0.840 1.605 1.585 1.566 1.547 2.246 2.210 2.174 2.140 2.798 2.743 2.690 2.639 3.274 3.199 3.127 3.058 3.685 3.589 3.498 3.410 4.039 3.922 3.812 3.706 4.344 4.207 4.078 3.954 4.607 4.451 4.303 4.163 4.833 4.659 4.494 4.339 5.029 4.836 4.656 4.486 5.197 4.988 4.793 4.611 5.342 5.118 4.910 4.715 5.468 5.229 5.008 4.802 5.575 5.324 5.092 4.876 0.833 1.528 2.106 2.589 2.991 3.326 3.605 3.837 4.031 4.192 4.327 4.439 4.533 4.611 4.675 1 2 3 4 5 6 7 8 9 10 11 12 13 14 15 Formulae sheet 1. Expected retum xp Ix outcome, p = probability of outcome) 1 2. Variance of 3. Standard deviation of 4. Expected retur on a 2 asset portfolio i, ai, ai, [a= proportion of funds invested in A whose mean retumis ij 5. Risk (standard deviation) of a 2 asset portfolio , vao (1-a) o 23(1-2)covit..ta) 6. Covariance coven) (MP [ta= outcomes for Aj CO2 7. Correlation con 8. CAPM required rate of return = r, B,(r. 1) In = risk free rate, tm = retum an market portfolio. B = beta of investment cov,) com 10 = standard deviation of j's retums 10. Beta of a firm with various activities B x, where x is the weighting for each activity D 11. Dividend valuation model generally P, IP = share price at time of D 12. DVM with constant growth P. D.01 ) D.(1 ) P & D P D. = current dividend D. = dividend in ne year 9- growth in dividends k = cost of equity] = interest on face value. T=tax] 13. After tax cost of irredeemable debtk (1 T) P 14. After tax cost of redeemable debt solve 0 (P) (I-TXAF. RV (I k.) where AF is an annuity factor and RV is the redemption value NPV NPV, NPV) Irdiscount rate giving NPV) UMADFR-15-3 Page 11 of 13 15. IRR