Answered step by step
Verified Expert Solution
Question
1 Approved Answer
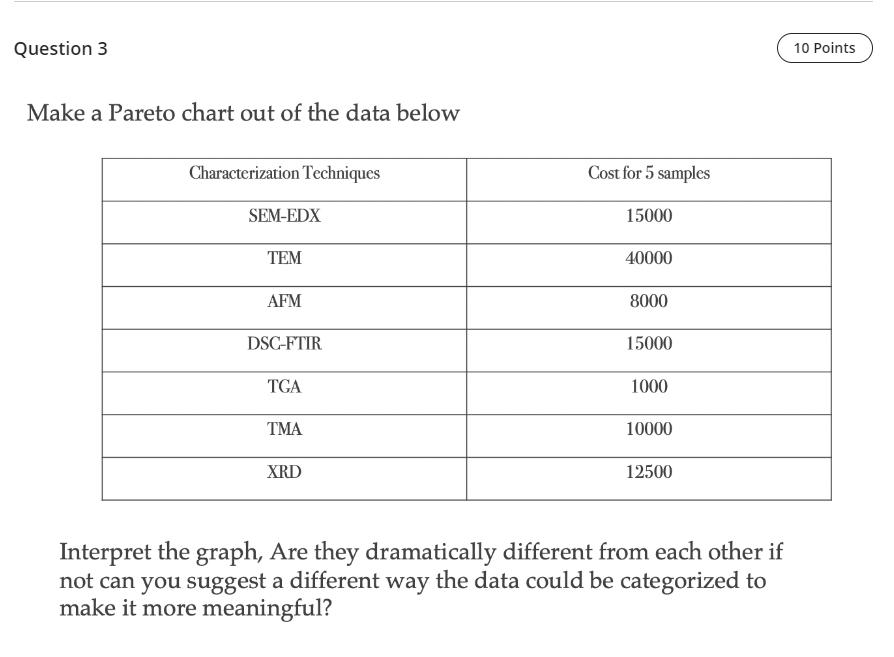
Question 3 Make a Pareto chart out of the data below table [ [ Characterization Techniques,Cost for 5 samples ] , [ SEM -
Question
Make a Pareto chart out of the data below
tableCharacterization Techniques,Cost for samplesSEMEDX,TEMAFMDSGFTIR,TGATMAXRD
Interpret the graph, Are they dramatically different from each other if not can you suggest a different way the data could be categorized to make it more meaningful?

Step by Step Solution
There are 3 Steps involved in it
Step: 1

Get Instant Access to Expert-Tailored Solutions
See step-by-step solutions with expert insights and AI powered tools for academic success
Step: 2

Step: 3

Ace Your Homework with AI
Get the answers you need in no time with our AI-driven, step-by-step assistance
Get Started


