Question
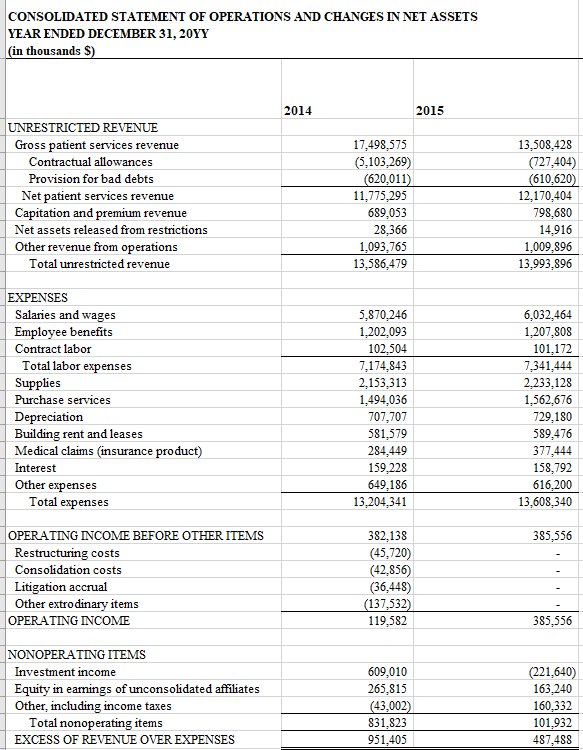
Question 3 The health system's total margin declined. Why was this? a. This was because a significant increase in contractual allowances. b. This was largely


Question 3
The health system's total margin declined. Why was this?
a. This was because a significant increase in contractual allowances.
b. This was largely because of a drop in investment income. Operating margin was the same in both years.
c. The hospitals market share declined
d. More information is needed to answer this question.
Question 4
What does a current ratio below 1.0 mean?
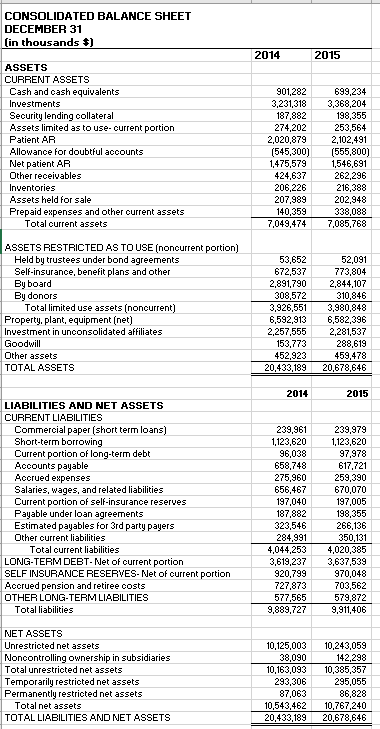
a. The company has more current liabilities than current assets. This signals a liquidity problem.
b. The company has more current assets than current liabilities. This signals a liquidity problem.
c. The company has more current liabilities than total equity. This signals a debt problem.
d. The company has more total equity than current assets. This signals a debt problem.
Question 5
How many days could the hospital continue operation if it was unable to collect any additional cash? Round to one decimal place. Ex: 32.1
Question 6
Does the hospital use more debt or equity to finance its operations? How do you know?
a. The debt ratio tells you the hospital uses slightly more equity, though the two proportions are close to being equal.
b. The debt ratio tells you the hospital uses slightly more debt, though the two proportions are close to being equal.
c. Because the current ratio is significantly greater than 1, you can tell the hospital uses more debt than equity.
d. Because the current ratio is significantly greater than 1, you can tell the hospital uses more equity than debt.
Question 7
How many dollars in revenue does each dollar invested in PP&E produce (on average)?
a. $0.46, this is fixed asset turnover.
b. $0.46, this is total asset turnover.
c. $2.19, this is total asset turnover.
d. $2.19, this is fixed asset turnover
Question 8
Why is fixed asset turnover higher than total asset turnover?
a. Because fixed asset turnover includes assets like cash that generates revenue directly.
b. Because fixed asset turnover doesnt utilize total revenues in its ratio.
c. Because total asset turnover includes assets like cash that dont generate revenue directly.
d. We do not have enough information to answer this.
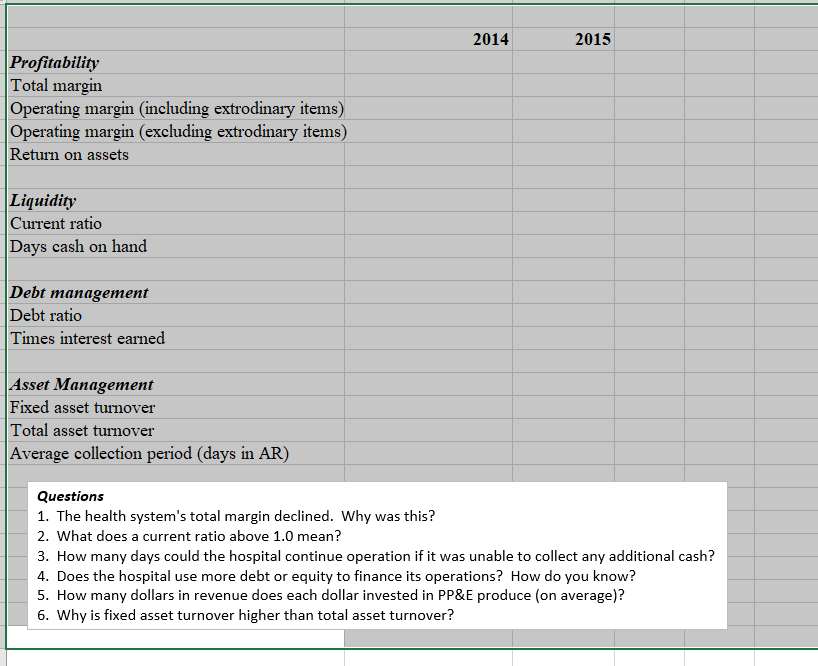
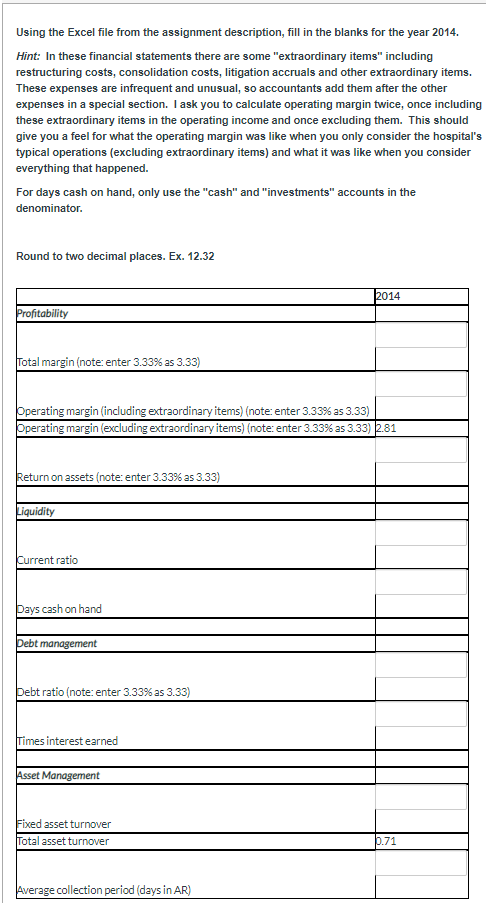
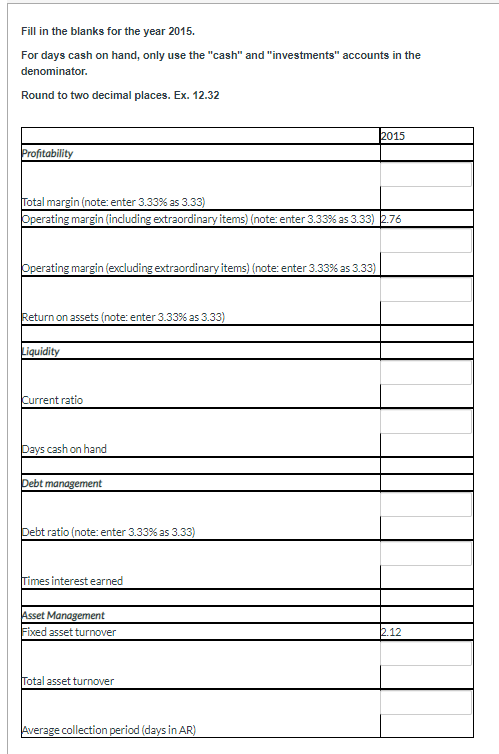
Instructions The 'Income Statement' and 'Balance Sheet' tabs include financial statement information for CHE-Trinity (Catholic Healthcare East-Trinity. This is a large NFP hospital system). Use this information to calculate the financial ratios on the "ratio analysis" tab then answer the questions. It won't always be clear how these ratios should be calculated. For instance, for the days cash on hand ratio does it make sense to include the "security lending collateral account or not? It isn't clear. On one hand, "security lending collateral" is a source of cash funds reserved to pay specific debts, so maybe it should be included. On the other hand, it can't be used to pay just any debt so maybe it shouldn't be included. When you have these questions think about the arguements for and against including an account, make a decision and record your assumption. CONSOLIDATED STATEMENT OF OPERATIONS AND CHANGES IN NET ASSETS YEAR ENDED DECEMBER 31, 20YY (in thousands $) 2014 2015 UNRESTRICTED REVENUE Gross patient services revenue Contractual allowances Provision for bad debts Net patient services revenue Capitation and premium revenue Net assets released from restrictions Other revenue from operations Total unrestricted revenue 17,498,575 (5.103,269) (620,011) 11,775,295 689,053 28,366 1,093,765 13,586,479 13,508,428 (727,404) (610,620) 12,170,404 798,680 14,916 1,009,896 13,993,896 EXPENSES Salaries and wages Employee benefits Contract labor Total labor expenses Supplies Purchase services Depreciation Building rent and leases Medical claims (insurance product) Interest Other expenses Total expenses 5,870.246 1,202,093 102,504 7.174.843 2,153,313 1,494,036 707,707 581,579 284,449 159,228 649,186 13.204.341 6,032,464 1,207,808 101,172 7,341,444 2.233,128 1,562,676 729,180 589,476 377,444 158,792 616,200 13,608,340 385,556 OPERATING INCOME BEFORE OTHER ITEMS Restructuring costs Consolidation costs Litigation accrual Other extro dinary items OPERATING INCOME 382,138 (45,720) (42.856) (36,448) (137,532) 119,582 385,556 NONOPERATING ITEMS Investment income Equity in earnings of unconsolidated affiliates Other, including income taxes Total nonoperating items EXCESS OF REVENUE OVER EXPENSES 609,010 265,815 (43,002) 831,823 951,405 (221,640) 163,240 160,332 101,932 487,488 CONSOLIDATED BALANCE SHEET DECEMBER 31 (in thousands $) 2014 2015 ASSETS CURRENT ASSETS Cash and cash equivalents Investments Security lending collateral Assets limited as to use-current portion Patient AR Allowance for doubtful accounts Net patient AR Other receivables Inventories Assets held for sale Prepaid expenses and other current assets Total current assets 901.282 3,231,318 187,882 274,202 2,020,879 (545,300) 1,475,579 424,637 206,226 207,989 140.359 7,049,474 699,234 3,368,204 198,355 253,564 2,102.491 (555,800) 1546.691 262,296 216,388 202,948 338,088 7,085,768 ASSETS RESTRICTED AS TO USE (noncurrent portion) Held by trustees under bond agreements Self-insurance, benefit plans and other By board By donors Total limited use assets (noncurrent) Property, plant, equipment (net) Investment in unconsolidated affiliates Goodwill Other assets TOTAL ASSETS 53,652 672,537 2,891,790 308,572 3,926,551 6,592,913 2,257,555 153,773 452,923 20,433,189 52,091 773,804 2,844,107 310,846 3,980,848 6,582,396 2,281,537 288,619 459,478 20,678,646 2014 2015 239,961 1123,620 LIABILITIES AND NET ASSETS CURRENT LIABILITIES Commercial paper (short term loans) Short-term borrowing Current portion of long-term debt Accounts payable Accrued expenses Salaries, wages, and related liabilities Current portion of self-insurance reserves Payable under loan agreements Estimated payables for 3rd party payers Other current liabilities Total current liabilities LONG-TERM DEBT-Net of current portion SELF INSURANCE RESERVES-Net of current portion Accrued pension and retiree costs OTHER LONG-TERM LIABILITIES Total liabilities 96,038 658,748 275,960 656,467 197,040 187,882 323,546 284.991 4,044,253 3,619,237 920,799 727,873 577,565 9,889,727 239,979 1,123,620 97,978 617,721 259,390 670,070 197,005 198,355 266,136 350.131 4,020,385 3,637,539 970,048 703,562 579.872 9,911,406 NET ASSETS Unrestricted net assets Noncontrolling ownership in subsidiaries Total unrestricted net assets Temporarily restricted net assets Permanently restricted net assets Total net assets TOTAL LIABILITIES AND NET ASSETS 10,125,003 38,090 10,163,093 293,306 87,063 10,543,462 20,433,189 10,243,059 142,298 10,385,357 295,055 86,828 10,767,240 20,678,646 2014 2015 Profitability Total margin Operating margin (including extrodinary items) Operating margin (excluding extrodinary items) Return on assets Liquidity Current ratio Days cash on hand Debt management Debt ratio Times interest earned Asset Management Fixed asset turnover Total asset turnover Average collection period (days in AR) Questions 1. The health system's total margin declined. Why was this? 2. What does a current ratio above 1.0 mean? 3. How many days could the hospital continue operation if it was unable to collect any additional cash? 4. Does the hospital use more debt or equity to finance its operations? How do you know? 5. How many dollars in revenue does each dollar invested in PP&E produce (on average)? 6. Why is fixed asset turnover higher than total asset turnover? Here are two bits of information you need: Here's an excel file a that has the financial statements you'll need to answer the questions. This file has all of the questions as the Canvas quiz. You'll need to put your answers into Canvas, but you may find it easier to calculate ratios in excel, since it allows you to directly reference cells to calculate ratios. If you use cell references in excel, then you can calculate the 2015 values for ratios very easily once you have the 2014 values. You'll just need to copy and past your formulas to the new column. There are a few multiple choice questions. I know a lot of people approach these by reading all the responses, crossing out the ones that are obviously wrong, then considering the remaining options. I suggest you answer these as if they're short answer. First write out your own answer, then find the response which most closely matches your answer. I think that trying to generate your own answer, not just evaluating the provided answers, will help the information stick with you better. Using the Excel file from the assignment description, fill in the blanks for the year 2014 Hint: In these financial statements there are some extraordinary items including restructuring costs, consolidation costs, litigation accruals and other extraordinary items. These expenses are infrequent and unusual, so accountants add them after the other expenses in a special section. I ask you to calculate operating margin twice, once including these extraordinary items in the operating income and once excluding them. This should give you a feel for what the operating margin was like when you only consider the hospital's typical operations (excluding extraordinary items) and what it was like when you consider everything that happened. For days cash on hand, only use the "cash" and "investments" accounts in the denominator. Round to two decimal places. Ex. 12.32 Profitability Total margin (note: enter 3.33% as 3.33) Operating margin (including extraordinary items) (note: enter 3.33% as 3.33) Operating margin (excluding extraordinary items) (note: enter 3.33% as 3.33) 2.81 Return on assets (note: enter 3.33% as 3.33) Liquidity Current ratio Pays cash on hand Debt management ebt ratio (note: enter 3.33% as 3.33) Times interest earned Asset Management Fixed asset turnover Total asset turnover Average collection period (days in AR) Fill in the blanks for the year 2015. For days cash on hand, only use the "cash" and "investments" accounts in the denominator. Round to two decimal places. Ex. 12.32 2015 Profitability Total margin (note: enter 3.33% as 3.33) Operating margin (including extraordinary items) (note enter 3.33% as 3.33) 2.76 Operating margin (excluding extraordinary items) (note: enter 3.33% as 3.33) Return on assets (note: enter 3.33% as 3.33) Tauidity Current ratio pays cash on hand pebt management Debt ratio (note: enter 3.33% as 3.33) Times interest earned Asset Management Fixed asset turnover Total asset turnover Average collection period (days in AR) Instructions The 'Income Statement' and 'Balance Sheet' tabs include financial statement information for CHE-Trinity (Catholic Healthcare East-Trinity. This is a large NFP hospital system). Use this information to calculate the financial ratios on the "ratio analysis" tab then answer the questions. It won't always be clear how these ratios should be calculated. For instance, for the days cash on hand ratio does it make sense to include the "security lending collateral account or not? It isn't clear. On one hand, "security lending collateral" is a source of cash funds reserved to pay specific debts, so maybe it should be included. On the other hand, it can't be used to pay just any debt so maybe it shouldn't be included. When you have these questions think about the arguements for and against including an account, make a decision and record your assumption. CONSOLIDATED STATEMENT OF OPERATIONS AND CHANGES IN NET ASSETS YEAR ENDED DECEMBER 31, 20YY (in thousands $) 2014 2015 UNRESTRICTED REVENUE Gross patient services revenue Contractual allowances Provision for bad debts Net patient services revenue Capitation and premium revenue Net assets released from restrictions Other revenue from operations Total unrestricted revenue 17,498,575 (5.103,269) (620,011) 11,775,295 689,053 28,366 1,093,765 13,586,479 13,508,428 (727,404) (610,620) 12,170,404 798,680 14,916 1,009,896 13,993,896 EXPENSES Salaries and wages Employee benefits Contract labor Total labor expenses Supplies Purchase services Depreciation Building rent and leases Medical claims (insurance product) Interest Other expenses Total expenses 5,870.246 1,202,093 102,504 7.174.843 2,153,313 1,494,036 707,707 581,579 284,449 159,228 649,186 13.204.341 6,032,464 1,207,808 101,172 7,341,444 2.233,128 1,562,676 729,180 589,476 377,444 158,792 616,200 13,608,340 385,556 OPERATING INCOME BEFORE OTHER ITEMS Restructuring costs Consolidation costs Litigation accrual Other extro dinary items OPERATING INCOME 382,138 (45,720) (42.856) (36,448) (137,532) 119,582 385,556 NONOPERATING ITEMS Investment income Equity in earnings of unconsolidated affiliates Other, including income taxes Total nonoperating items EXCESS OF REVENUE OVER EXPENSES 609,010 265,815 (43,002) 831,823 951,405 (221,640) 163,240 160,332 101,932 487,488 CONSOLIDATED BALANCE SHEET DECEMBER 31 (in thousands $) 2014 2015 ASSETS CURRENT ASSETS Cash and cash equivalents Investments Security lending collateral Assets limited as to use-current portion Patient AR Allowance for doubtful accounts Net patient AR Other receivables Inventories Assets held for sale Prepaid expenses and other current assets Total current assets 901.282 3,231,318 187,882 274,202 2,020,879 (545,300) 1,475,579 424,637 206,226 207,989 140.359 7,049,474 699,234 3,368,204 198,355 253,564 2,102.491 (555,800) 1546.691 262,296 216,388 202,948 338,088 7,085,768 ASSETS RESTRICTED AS TO USE (noncurrent portion) Held by trustees under bond agreements Self-insurance, benefit plans and other By board By donors Total limited use assets (noncurrent) Property, plant, equipment (net) Investment in unconsolidated affiliates Goodwill Other assets TOTAL ASSETS 53,652 672,537 2,891,790 308,572 3,926,551 6,592,913 2,257,555 153,773 452,923 20,433,189 52,091 773,804 2,844,107 310,846 3,980,848 6,582,396 2,281,537 288,619 459,478 20,678,646 2014 2015 239,961 1123,620 LIABILITIES AND NET ASSETS CURRENT LIABILITIES Commercial paper (short term loans) Short-term borrowing Current portion of long-term debt Accounts payable Accrued expenses Salaries, wages, and related liabilities Current portion of self-insurance reserves Payable under loan agreements Estimated payables for 3rd party payers Other current liabilities Total current liabilities LONG-TERM DEBT-Net of current portion SELF INSURANCE RESERVES-Net of current portion Accrued pension and retiree costs OTHER LONG-TERM LIABILITIES Total liabilities 96,038 658,748 275,960 656,467 197,040 187,882 323,546 284.991 4,044,253 3,619,237 920,799 727,873 577,565 9,889,727 239,979 1,123,620 97,978 617,721 259,390 670,070 197,005 198,355 266,136 350.131 4,020,385 3,637,539 970,048 703,562 579.872 9,911,406 NET ASSETS Unrestricted net assets Noncontrolling ownership in subsidiaries Total unrestricted net assets Temporarily restricted net assets Permanently restricted net assets Total net assets TOTAL LIABILITIES AND NET ASSETS 10,125,003 38,090 10,163,093 293,306 87,063 10,543,462 20,433,189 10,243,059 142,298 10,385,357 295,055 86,828 10,767,240 20,678,646 2014 2015 Profitability Total margin Operating margin (including extrodinary items) Operating margin (excluding extrodinary items) Return on assets Liquidity Current ratio Days cash on hand Debt management Debt ratio Times interest earned Asset Management Fixed asset turnover Total asset turnover Average collection period (days in AR) Questions 1. The health system's total margin declined. Why was this? 2. What does a current ratio above 1.0 mean? 3. How many days could the hospital continue operation if it was unable to collect any additional cash? 4. Does the hospital use more debt or equity to finance its operations? How do you know? 5. How many dollars in revenue does each dollar invested in PP&E produce (on average)? 6. Why is fixed asset turnover higher than total asset turnover? Here are two bits of information you need: Here's an excel file a that has the financial statements you'll need to answer the questions. This file has all of the questions as the Canvas quiz. You'll need to put your answers into Canvas, but you may find it easier to calculate ratios in excel, since it allows you to directly reference cells to calculate ratios. If you use cell references in excel, then you can calculate the 2015 values for ratios very easily once you have the 2014 values. You'll just need to copy and past your formulas to the new column. There are a few multiple choice questions. I know a lot of people approach these by reading all the responses, crossing out the ones that are obviously wrong, then considering the remaining options. I suggest you answer these as if they're short answer. First write out your own answer, then find the response which most closely matches your answer. I think that trying to generate your own answer, not just evaluating the provided answers, will help the information stick with you better. Using the Excel file from the assignment description, fill in the blanks for the year 2014 Hint: In these financial statements there are some extraordinary items including restructuring costs, consolidation costs, litigation accruals and other extraordinary items. These expenses are infrequent and unusual, so accountants add them after the other expenses in a special section. I ask you to calculate operating margin twice, once including these extraordinary items in the operating income and once excluding them. This should give you a feel for what the operating margin was like when you only consider the hospital's typical operations (excluding extraordinary items) and what it was like when you consider everything that happened. For days cash on hand, only use the "cash" and "investments" accounts in the denominator. Round to two decimal places. Ex. 12.32 Profitability Total margin (note: enter 3.33% as 3.33) Operating margin (including extraordinary items) (note: enter 3.33% as 3.33) Operating margin (excluding extraordinary items) (note: enter 3.33% as 3.33) 2.81 Return on assets (note: enter 3.33% as 3.33) Liquidity Current ratio Pays cash on hand Debt management ebt ratio (note: enter 3.33% as 3.33) Times interest earned Asset Management Fixed asset turnover Total asset turnover Average collection period (days in AR) Fill in the blanks for the year 2015. For days cash on hand, only use the "cash" and "investments" accounts in the denominator. Round to two decimal places. Ex. 12.32 2015 Profitability Total margin (note: enter 3.33% as 3.33) Operating margin (including extraordinary items) (note enter 3.33% as 3.33) 2.76 Operating margin (excluding extraordinary items) (note: enter 3.33% as 3.33) Return on assets (note: enter 3.33% as 3.33) Tauidity Current ratio pays cash on hand pebt management Debt ratio (note: enter 3.33% as 3.33) Times interest earned Asset Management Fixed asset turnover Total asset turnover Average collection period (days in AR)
Step by Step Solution
There are 3 Steps involved in it
Step: 1

Get Instant Access to Expert-Tailored Solutions
See step-by-step solutions with expert insights and AI powered tools for academic success
Step: 2

Step: 3

Ace Your Homework with AI
Get the answers you need in no time with our AI-driven, step-by-step assistance
Get Started


