Question 36
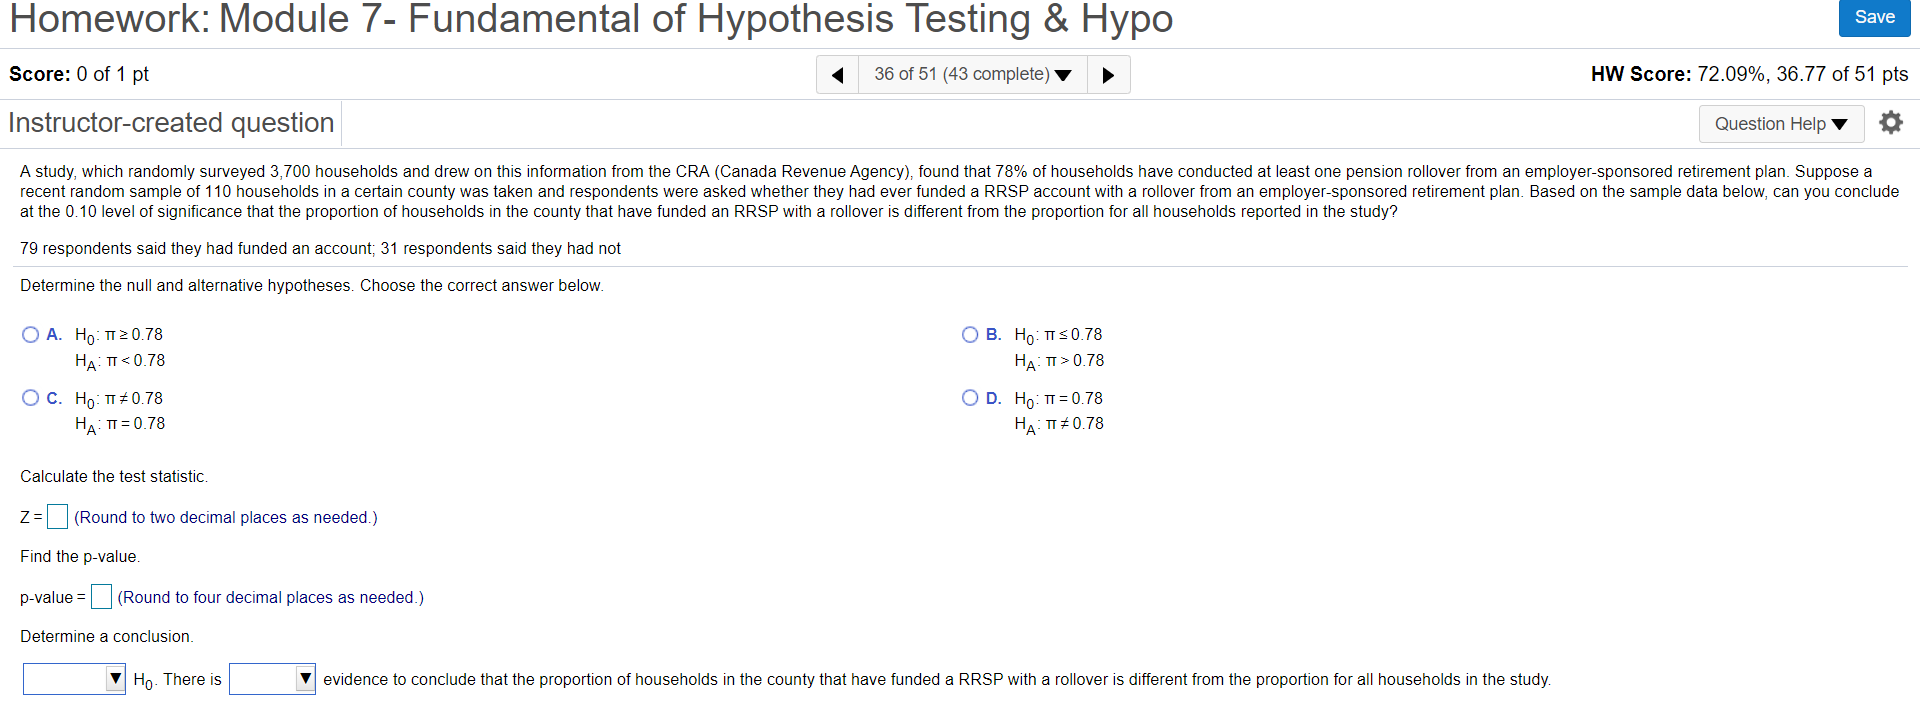
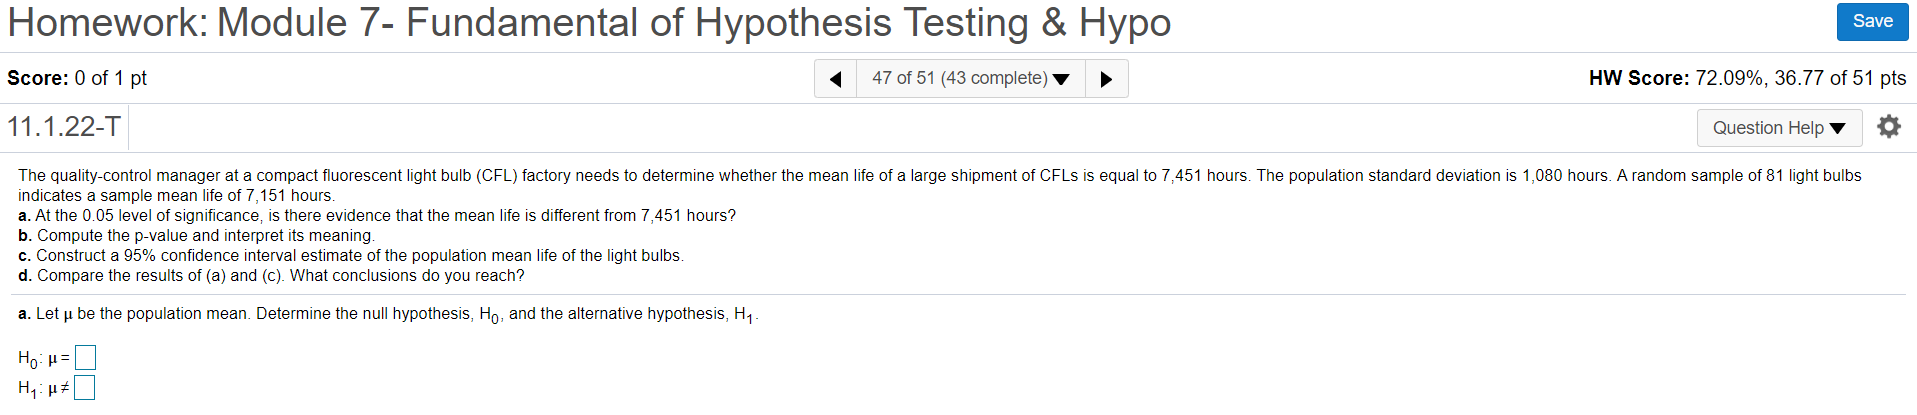
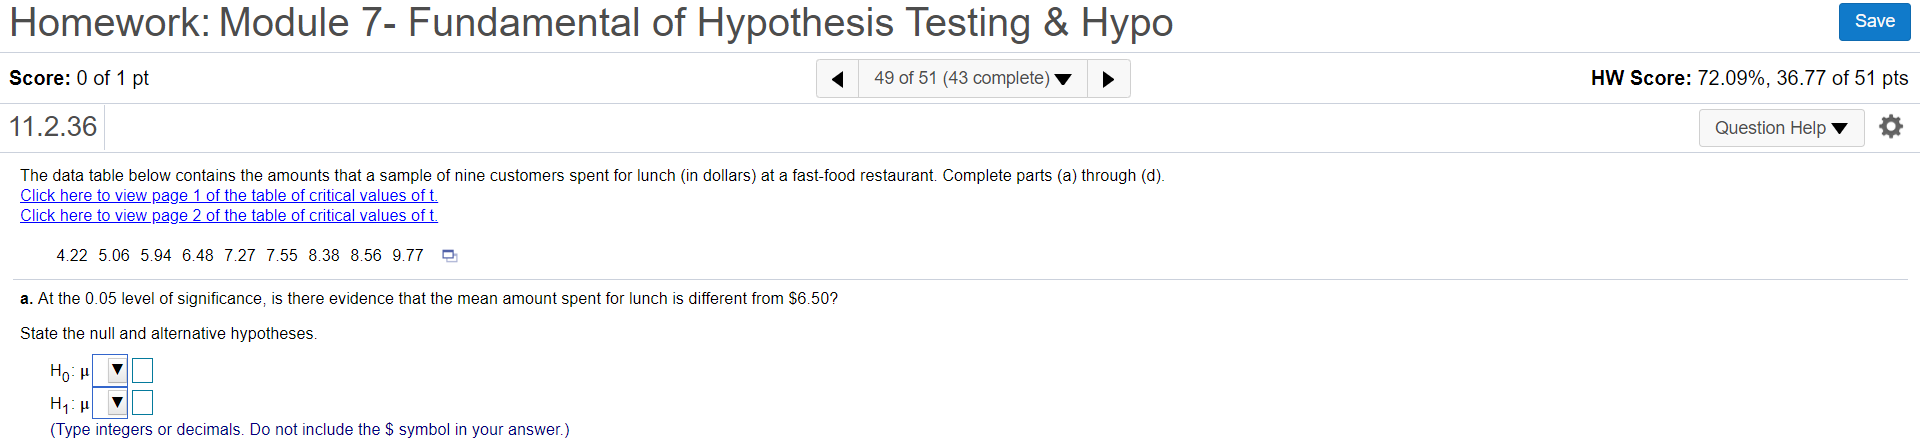
Homework: Module 7- Fundamental of Hypothesis Testing & Hypo Save Score: 0 of 1 pt 36 of 51 (43 complete) HW Score: 72.09%, 36.77 of 51 pts Instructor-created question Question Help A study, which randomly surveyed 3,700 households and drew on this information from the CRA (Canada Revenue Agency), found that 78% of households have conducted at least one pension rollover from an employer-sponsored retirement plan. Suppose a recent random sample of 110 households in a certain county was taken and respondents were asked whether they had ever funded a RRSP account with a rollover from an employer-sponsored retirement plan. Based on the sample data below, can you conclude at the 0.10 level of significance that the proportion of households in the county that have funded an RRSP with a rollover is different from the proportion for all households reported in the study? 79 respondents said they had funded an account; 31 respondents said they had not Determine the null and alternative hypotheses. Choose the correct answer below. O A. Ho: TI 2 0.78 O B. HO: TIS0.78 HA: TT 0.78 O C. Ho: TT # 0.78 O D. Ho: TT = 0.78 HA : TT = 0.78 HA : TI # 0.78 Calculate the test statistic. z= (Round to two decimal places as needed.) Find the p-value. p-value = (Round to four decimal places as needed.) Determine a conclusion. Ho- There is evidence to conclude that the proportion of households in the county that have funded a RRSP with a rollover is different from the proportion for all households in the study.Homework: Module 7- Fundamental of Hypothesis Testing & Hypo Save Score: 0 of 1 pt 47 of 51 (43 complete) HW Score: 72.09%, 36.77 of 51 pts 11.1.22-T Question Help The quality-control manager at a compact fluorescent light bulb (CFL) factory needs to determine whether the mean life of a large shipment of CFLs is equal to 7,451 hours. The population standard deviation is 1,080 hours. A random sample of 81 light bulbs indicates a sample mean life of 7,151 hours. a. At the 0.05 level of significance, is there evidence that the mean life is different from 7,451 hours? b. Compute the p-value and interpret its meaning. c. Construct a 95% confidence interval estimate of the population mean life of the light bulbs. d. Compare the results of (a) and (c). What conclusions do you reach? a. Let u be the population mean. Determine the null hypothesis, Ho, and the alternative hypothesis, H1. HO - H =Homework: Module 7- Fundamental of Hypothesis Testing & Hypo Save Score: 0 of 1 pt 49 of 51 (43 complete) HW Score: 72.09%, 36.77 of 51 pts 11.2.36 Question Help The data table below contains the amounts that a sample of nine customers spent for lunch (in dollars) at a fast-food restaurant. Complete parts (a) through (d). Click here to view page 1 of the table of critical values of t. Click here to view page 2 of the table of critical values of t. 4.22 5.06 5.94 6.48 7.27 7.55 8.38 8.56 9.77 a. At the 0.05 level of significance, is there evidence that the mean amount spent for lunch is different from $6.50? State the null and alternative hypotheses. Ho- H Hy : H (Type integers or decimals. Do not include the $ symbol in your answer.)