

Answered step by step
Verified Expert Solution
Question
1 Approved Answer
Question 4 A two - dimensional graph representing the data using different shades of color to indicate magnitude is called a heat map. bubble chart.
Question
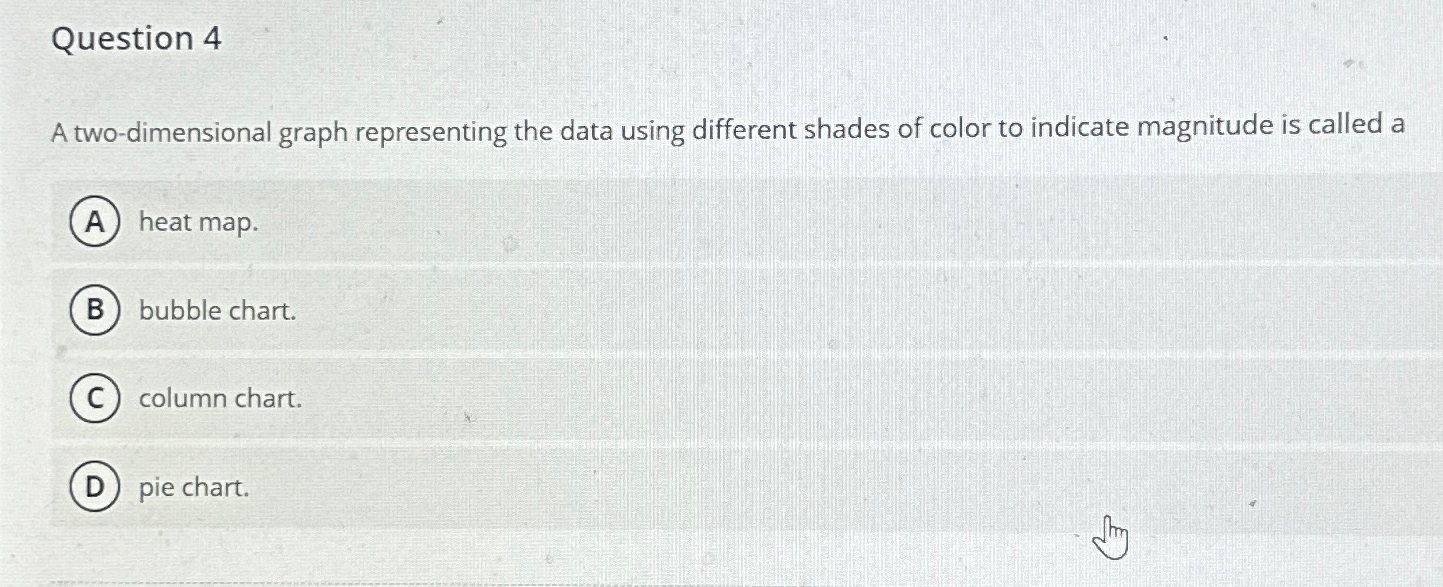
A twodimensional graph representing the data using different shades of color to indicate magnitude is called a
heat map.
bubble chart.
column chart.
pie chart.
Step by Step Solution
There are 3 Steps involved in it
Step: 1

Get Instant Access to Expert-Tailored Solutions
See step-by-step solutions with expert insights and AI powered tools for academic success
Step: 2

Step: 3
Ace Your Homework with AI
Get the answers you need in no time with our AI-driven, step-by-step assistance
Get Started
Financial And Managerial Accounting For School Administrators
Authors: Ronald E. Everett, Raymond L. Lows, Donald R. Johnson
1st Edition
157886027X, 9781578860272