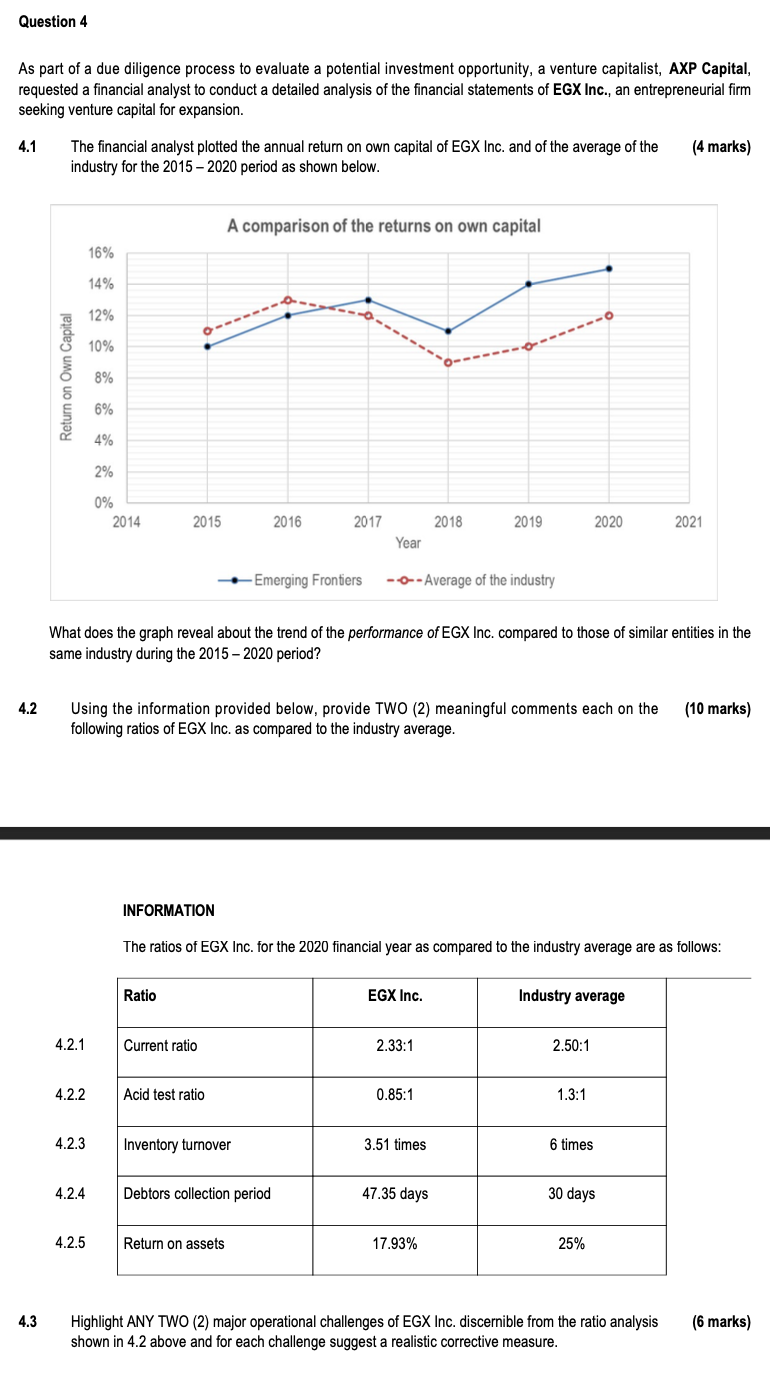
Question 4 As part of a due diligence process to evaluate a potential investment opportunity, a venture capitalist, AXP Capital, requested a financial analyst to conduct a detailed analysis of the financial statements of EGX Inc., an entrepreneurial firm seeking venture capital for expansion. 4.1 (4 marks) The financial analyst plotted the annual return on own capital of EGX Inc. and of the average of the industry for the 2015-2020 period as shown below. A comparison of the returns on own capital 16% 14% 12% 10% Return on Own Capital 8% 6% 4% 2% 0% 2014 2015 2016 2017 2018 2019 2020 2021 Year Emerging Frontiers --- Average of the industry What does the graph reveal about the trend of the performance of EGX Inc. compared to those of similar entities in the same industry during the 2015 - 2020 period? 4.2 Using the information provided below, provide TWO (2) meaningful comments each on the following ratios of EGX Inc. as compared to the industry average. (10 marks) INFORMATION The ratios of EGX Inc. for the 2020 financial year as compared to the industry average are as follows: Ratio EGX Inc. Industry average 4.2.1 Current ratio 2.33:1 2.50:1 4.2.2 Acid test ratio 0.85:1 1.3:1 4.2.3 Inventory turnover 3.51 times 6 times 4.2.4 Debtors collection period 47.35 days 30 days 4.2.5 Return on assets 17.93% 25% 4.3 (6 marks) Highlight ANY TWO (2) major operational challenges of EGX Inc. discernible from the ratio analysis shown in 4.2 above and for each challenge suggest a realistic corrective measure. Question 4 As part of a due diligence process to evaluate a potential investment opportunity, a venture capitalist, AXP Capital, requested a financial analyst to conduct a detailed analysis of the financial statements of EGX Inc., an entrepreneurial firm seeking venture capital for expansion. 4.1 (4 marks) The financial analyst plotted the annual return on own capital of EGX Inc. and of the average of the industry for the 2015-2020 period as shown below. A comparison of the returns on own capital 16% 14% 12% 10% Return on Own Capital 8% 6% 4% 2% 0% 2014 2015 2016 2017 2018 2019 2020 2021 Year Emerging Frontiers --- Average of the industry What does the graph reveal about the trend of the performance of EGX Inc. compared to those of similar entities in the same industry during the 2015 - 2020 period? 4.2 Using the information provided below, provide TWO (2) meaningful comments each on the following ratios of EGX Inc. as compared to the industry average. (10 marks) INFORMATION The ratios of EGX Inc. for the 2020 financial year as compared to the industry average are as follows: Ratio EGX Inc. Industry average 4.2.1 Current ratio 2.33:1 2.50:1 4.2.2 Acid test ratio 0.85:1 1.3:1 4.2.3 Inventory turnover 3.51 times 6 times 4.2.4 Debtors collection period 47.35 days 30 days 4.2.5 Return on assets 17.93% 25% 4.3 (6 marks) Highlight ANY TWO (2) major operational challenges of EGX Inc. discernible from the ratio analysis shown in 4.2 above and for each challenge suggest a realistic corrective measure


