Question 4
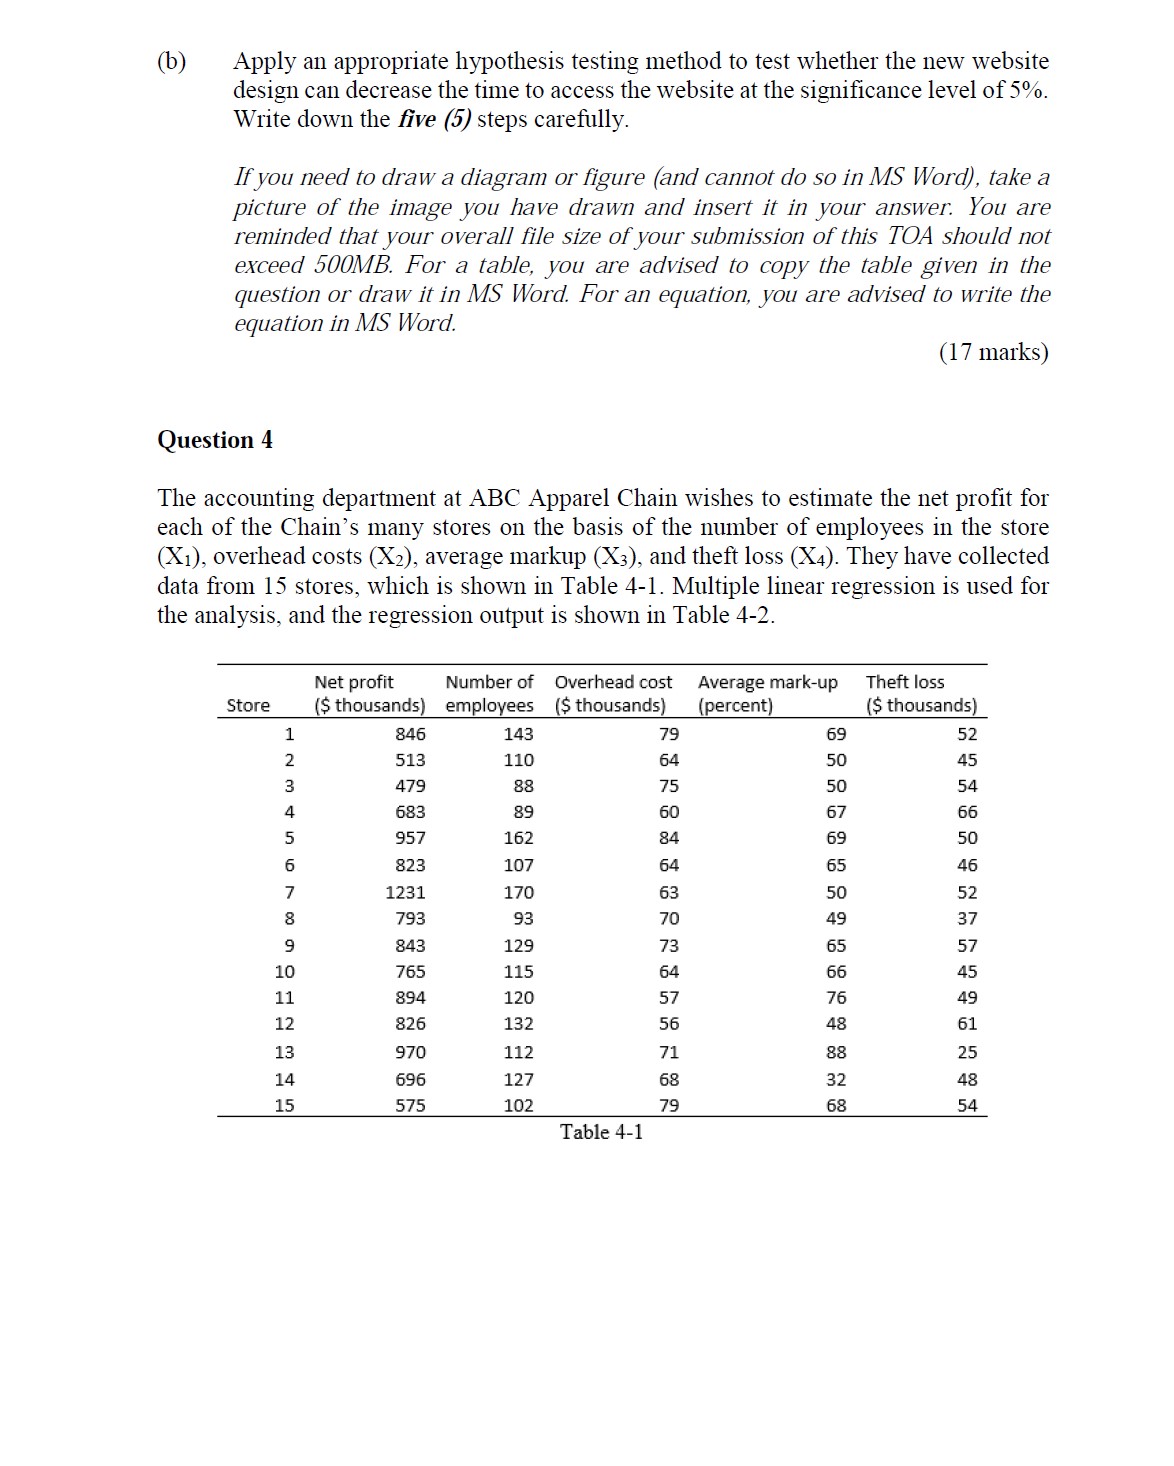
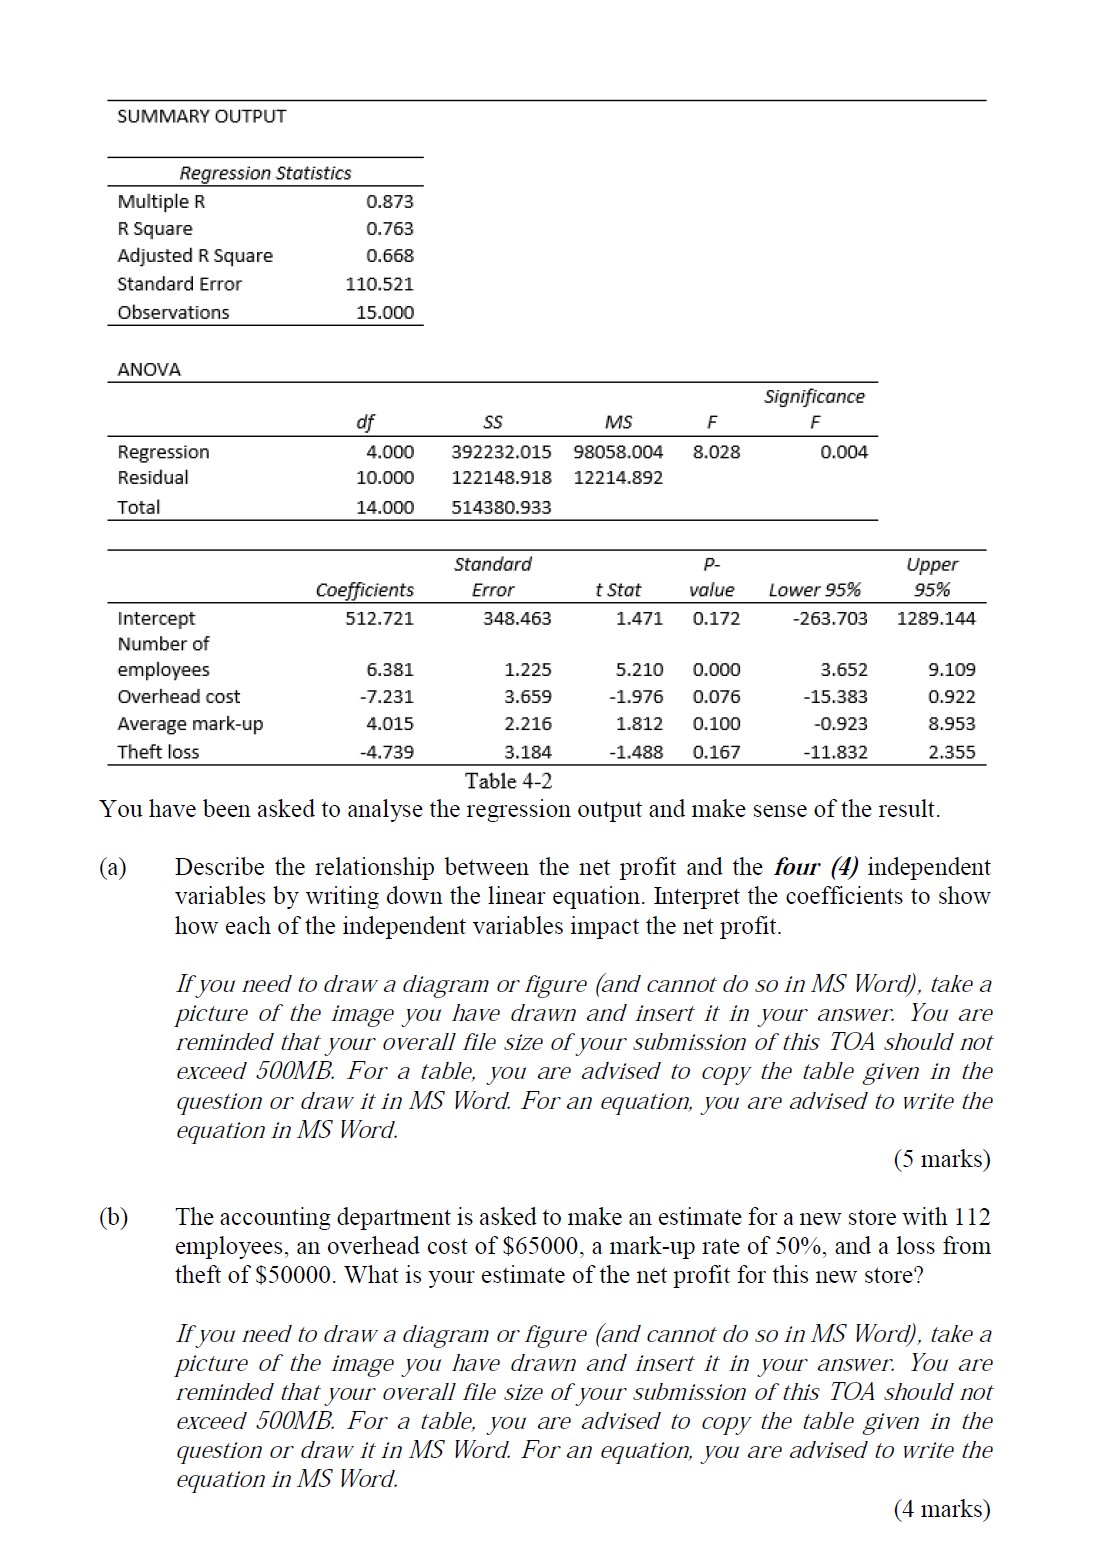
The accounting department at ABC Apparel Chain wishes to estimate the net profit for each of the Chain's many stores on the basis of the number of employees in the store (X1), overhead costs (X2), average markup (X3), and theft loss (X4). They have collected data from 15 stores, which is shown in Table 4-1. Multiple linear regression is used for the analysis, and the regression output is shown in Table 4-2.
(b) The accounting department is asked to make an estimate for a new store with 112 employees, an overhead cost of $65000, a mark-up rate of 50%, and a loss from theft of $50000. What is your estimate of the net profit for this new store?
If you need to draw a diagram or figure (and cannot do so in MS Word), take a picture of the image you have drawn and insert it in your answer. You are reminded that your overall file size of your submission of this TOA should not exceed 500MB. For a table, you are advised to copy the table given in the question or draw it in MS Word. For an equation, you are advised to write the equation in MS Word.
(4 marks)
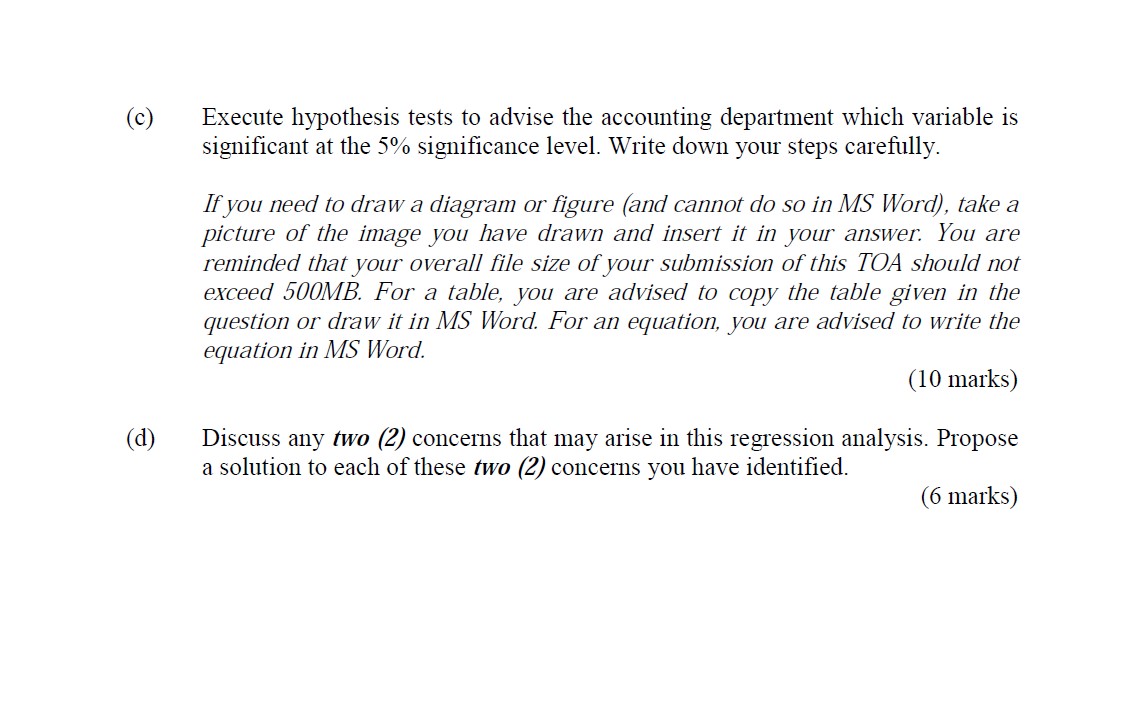
(b) Apply an appropriate hypothesis testing method to test whether the new website design can decrease the time to access the website at the signicance level of 5%. Write down the ve (5) steps carefully. If you need to draw a diagram or gure (and cannot do so in MS Word, take a picture of the image you have drawn and insert it in your answer. You are reminded that your overall file size of your submission of this TOA shouid not exceed 500MB. For a table, you are advised to copy the table given in the question or draw it in MS Word. For an equation, you are advised to write the equation in MS Word. (17 marks) Question 4 The accounting department at ABC Apparel Chain wishes to estimate the net prot for each of the Chain's many stores on the basis of the number of employees in the store (X1), overhead costs (X2), average markup (X3), and theft loss (X4). They have collected data from 15 stores, which is shown in Table 41. Multiple linear regression is used for the analysis, and the regression output is shown in Table 4-2. Net profit Number of overhead cost Average markup Theft loss Store (5 thousands] employees [5 thousands} {percent} (5 thousands) 1 346 143 79 69 52 2 513 110 64 50 45 3 479 88 75 50 54 4 683 89 60 67 66 5 957 162 84 69 50 6 823 107 64 65 46 7 1231 170 63 50 52 8 793 93 70 49 37 9 843 129 73 65 57 10 765 115 64 66 45 11 894 120 57 76 49 12 826 132 56 48 61 13 970 112 71 88 25 14 696 127 68 32 48 15 575 102 79 68 54 Table 4-1 SUMMARY OUTPUT Regression Statistics Multiple R 0.873 R Square 0.763 Adjusted R Square 0.668 Standard Error 110.521 Observations 15.000 ANOVA Significance df SS MS F F Regression 4.000 392232.015 98058.004 8.028 0.004 Residual 10.000 122148.918 12214.892 Total 14.000 514380.933 Standard P- Upper Coefficients Error t Stat value Lower 95% 95% Intercept 512.721 348.463 1.471 0.172 263.703 1289.144 Number of employees 6.381 1.225 5.210 0.000 3.652 9.109 Overhead cost 7.231 3.659 -1.976 0.076 -15.383 0.922 Average mark-up 4.015 2.216 1.812 0.100 -0.923 8.953 Theft loss -4.739 3.184 -1.488 0.167 -11.832 2.355 Table 4-2 You have been asked to analyse the regression output and make sense of the result. (a) Describe the relationship between the net profit and the four (4) independent variables by writing down the linear equation. Interpret the coefficients to show how each of the independent variables impact the net profit. If you need to draw a diagram or figure (and cannot do so in MS Word), take a picture of the image you have drawn and insert it in your answer. You are reminded that your overall file size of your submission of this TOA should not exceed 500MB. For a table, you are advised to copy the table given in the question or draw it in MS Word. For an equation, you are advised to write the equation in MS Word. (5 marks) (b ) The accounting department is asked to make an estimate for a new store with 112 employees, an overhead cost of $65000, a mark-up rate of 50%, and a loss from theft of $50000. What is your estimate of the net profit for this new store? If you need to draw a diagram or figure (and cannot do so in MS Word), take a picture of the image you have drawn and insert it in your answer. You are reminded that your overall file size of your submission of this TOA should not exceed 500MB. For a table, you are advised to copy the table given in the question or draw it in MS Word. For an equation, you are advised to write the equation in MS Word. (4 marks)(c) Execute hypothesis tests to advise the accounting department which variable is significant at the 5% significance level. Write down your steps carefully. If you need to draw a diagram or figure (and cannot do so in MS Word), take a picture of the image you have drawn and insert it in your answer. You are reminded that your overall file size of your submission of this TOA should not exceed 500MB. For a table, you are advised to copy the table given in the question or draw it in MS Word. For an equation, you are advised to write the equation in MS Word. (10 marks) (d) Discuss any two (2) concerns that may arise in this regression analysis. Propose a solution to each of these two (2) concerns you have identified. (6 marks)


