

Question
QUESTION 4 The lecturer wishes to draw histograms in presenting graphical summaries of the data on the two main variables concerned - weekly working hours
QUESTION 4
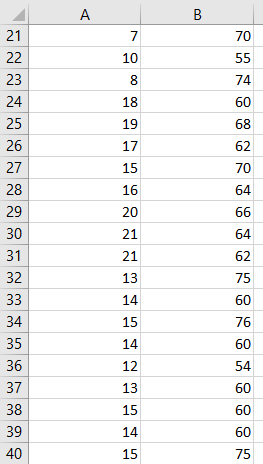
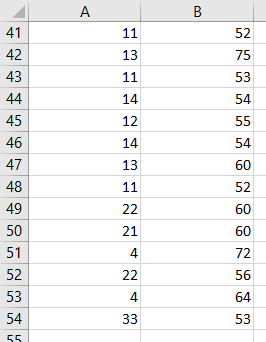
The lecturer wishes to draw histograms in presenting graphical summaries of the data on the two main variables concerned - weekly working hours and marks attained, as stored in the worksheet. attached here
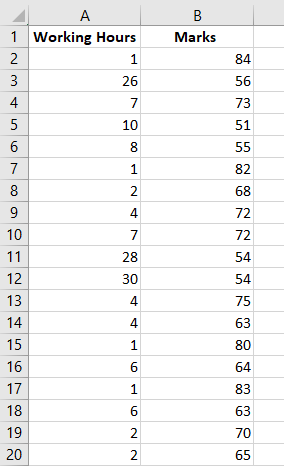
- He decided to use 7 class intervals to construct a histogram for each variable. Explain how the lecturer could have decided in using 7 as the number of class intervals to be used.
- The lecturer specified class intervals 0
- Using Excel, draw and display the histogram for the working hours variable using the class intervals specified in part (b). Comment on the shape of the distribution of the data set as displayed in the histogram.
4. Using Excel, draw and display the histogram for the marks attained variable using the class intervals specified in part (b). Comment on the shape of the distribution of the data set as displayed in the histogram.
B Marks 84 26 56 73 A 1 1 Working Hours 2 1 3 4 7 5 10 6 8 7 1 8 2 9 10 7 11 28 12 30 13 4 14 4 15 1 16 6 17 1 18 6 19 2 20 2 51 55 82 68 72 72 4 54 54 75 63 80 64 83 63 70 65 D B B 21 7 70 22 10 55 74 8 18 60 68 19 17 62 15 70 64 66 23 24 25 26 27 28 29 30 31 32 33 34 35 36 64 62 16 20 21 21 13 14 15 14 75 60 76 60 54 12 13 15 14 37 38 39 40 60 60 60 15 75 A B 11 41 42 52 75 13 43 11 53 54 14 12 14 13 44 45 46 47 48 49 50 51 52 53 54 55 54 60 52 60 11 22 21 60 4 72 22 56 4 64 33 53 55 B Marks 84 26 56 73 A 1 1 Working Hours 2 1 3 4 7 5 10 6 8 7 1 8 2 9 10 7 11 28 12 30 13 4 14 4 15 1 16 6 17 1 18 6 19 2 20 2 51 55 82 68 72 72 4 54 54 75 63 80 64 83 63 70 65 D B B 21 7 70 22 10 55 74 8 18 60 68 19 17 62 15 70 64 66 23 24 25 26 27 28 29 30 31 32 33 34 35 36 64 62 16 20 21 21 13 14 15 14 75 60 76 60 54 12 13 15 14 37 38 39 40 60 60 60 15 75 A B 11 41 42 52 75 13 43 11 53 54 14 12 14 13 44 45 46 47 48 49 50 51 52 53 54 55 54 60 52 60 11 22 21 60 4 72 22 56 4 64 33 53 55Step by Step Solution
There are 3 Steps involved in it
Step: 1

Get Instant Access to Expert-Tailored Solutions
See step-by-step solutions with expert insights and AI powered tools for academic success
Step: 2

Step: 3
Ace Your Homework with AI
Get the answers you need in no time with our AI-driven, step-by-step assistance
Get Started
The International Handbook Of Public Financial Management
Authors: Richard Allen, Richard Hemming, B. Potter
1st Edition
1137574895, 978-1137574893