Answered step by step
Verified Expert Solution
Link Copied!

Question

1 Approved Answer

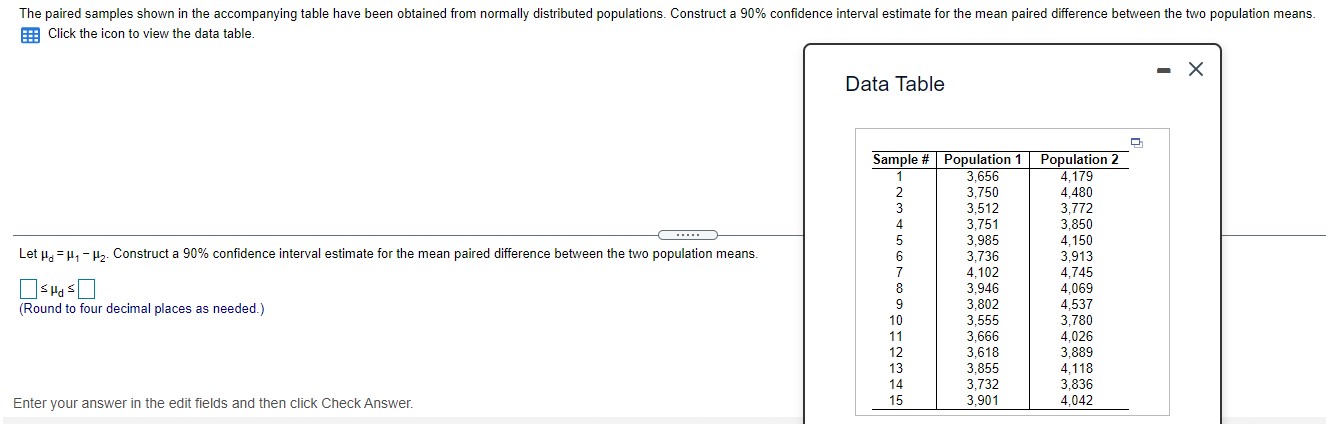
Question 4 The paired samples shown in the accompanying table have been obtained from normally distributed populations. Construct a 90% confidence interval estimate for the

Question 4

image text in transcribed
The paired samples shown in the accompanying table have been obtained from normally distributed populations. Construct a 90% confidence interval estimate for the mean paired difference between the two population means. Click the icon to view the data table. X Data Table Sample # |Population 1 Population 2 3.656 4,179 3,750 4.480 3,512 3,772 3,751 3.850 3.985 4, 150 Let He = Hy - H2. Construct a 90% confidence interval estimate for the mean paired difference between the two population means. 3,736 3,913 4.102 4.745 SHd =] 3,946 4,069 (Round to four decimal places as needed.) 3,802 4,537 3,555 3,780 3,666 4,026 12 3,618 3,889 13 3,855 4, 118 14 3,732 3,836 Enter your answer in the edit fields and then click Check Answer. 15 3.901 4,042

Step by Step Solution

There are 3 Steps involved in it

Step: 1

blur-text-image

Get Instant Access to Expert-Tailored Solutions

See step-by-step solutions with expert insights and AI powered tools for academic success

Step: 2

blur-text-image

Step: 3

blur-text-image

Ace Your Homework with AI

Get the answers you need in no time with our AI-driven, step-by-step assistance

Get Started

Recommended Textbook for

Trigonometry

Authors: Cynthia Y Young

5th Edition

1119820928, 9781119820925

More Books

Students also viewed these Mathematics questions