Question: QUESTION 41 The scatter plot shows the relationship between average number of years of education and births per woman of child bearing age in selected
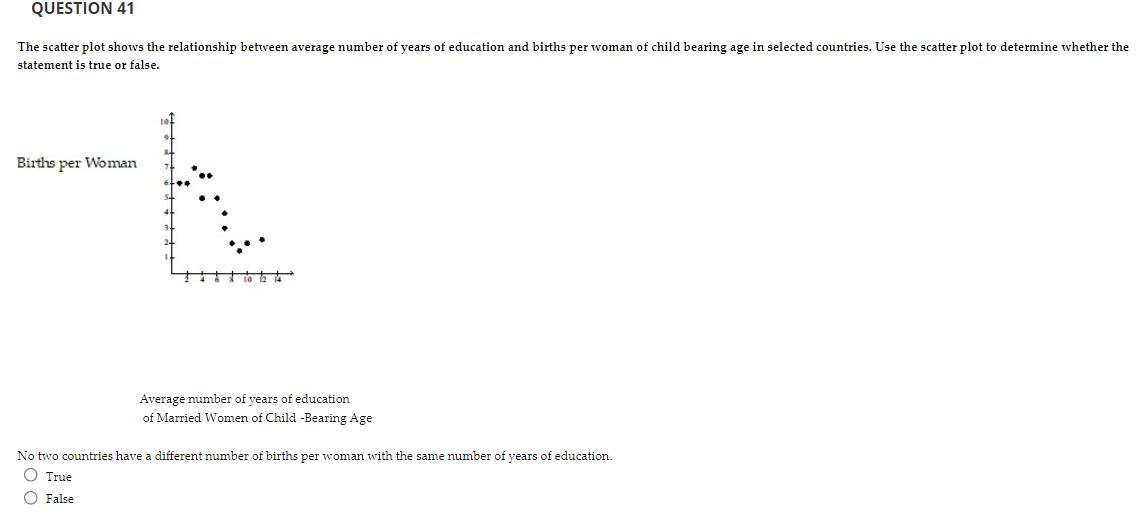
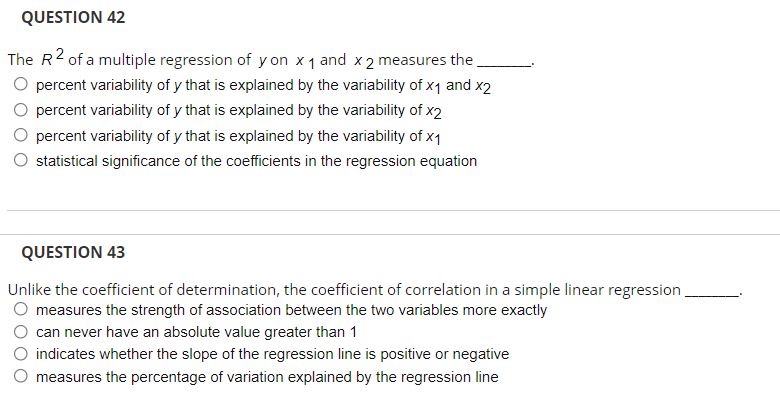
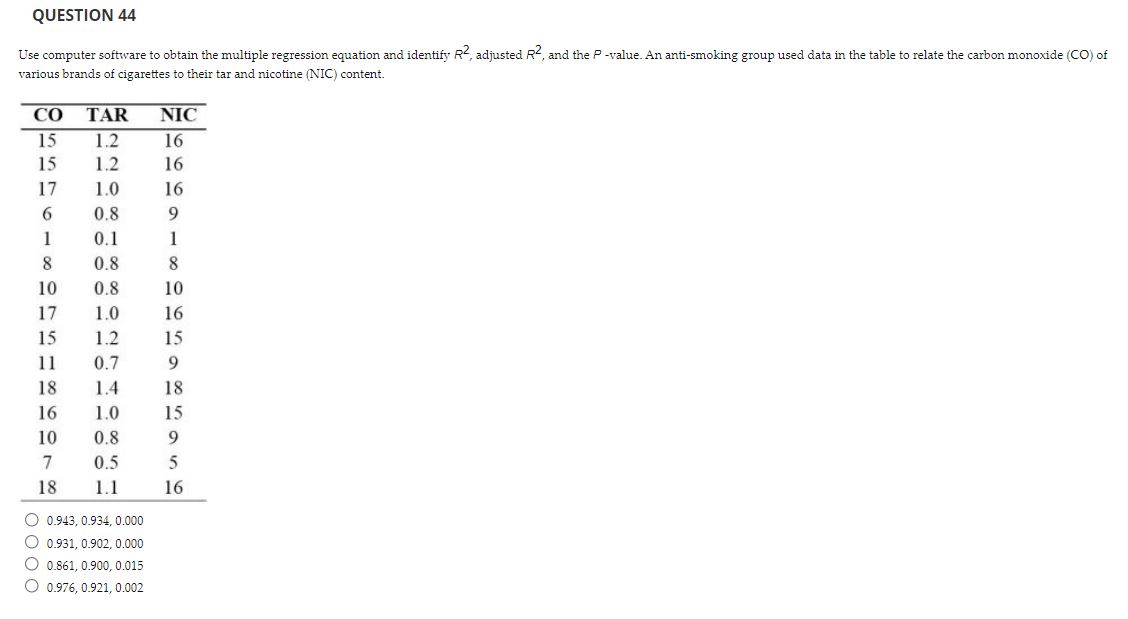
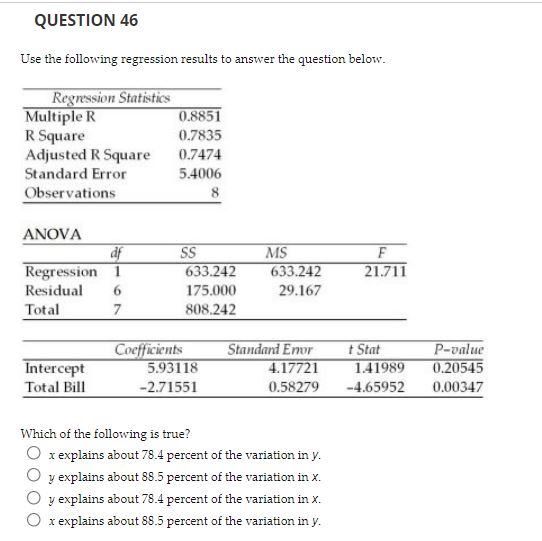
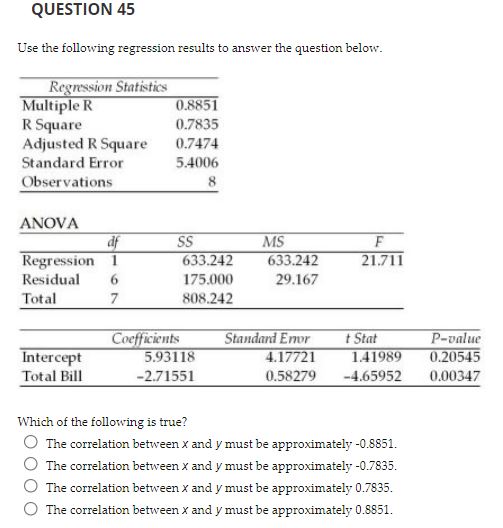

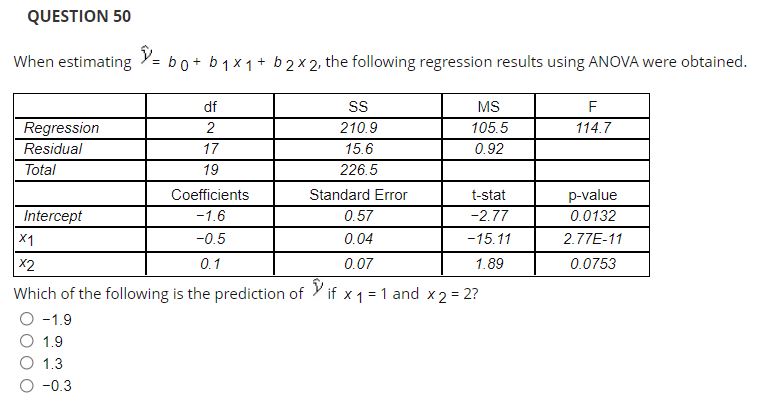
QUESTION 41 The scatter plot shows the relationship between average number of years of education and births per woman of child bearing age in selected countries. Use the scatter piot to detennine wheler the statement is true or false. Average rmmber of years of education of Married W'omen of Child Bearing Age No two countries have a different number of births per woman with the same number of years of education. OTrue OFaJse QUESTION 42 The R2 ofa multiple regression of yon x1 and x2 measures the 0 percent variability of ythat is explained by the variability of x1 and x2 0 percent variability of ythat is explained by the variability of x2 0 percent variability of ythat is explained by the variability of x1 0 statistical signicance of the coefcients in the regression equation QUESTION 43 Unlike the coefficient of determination. the coefficient of correlation in a simple linear regression 0 measures the strength of association between the two variables more exactly 0 can never have an absolute value greater than 1 0 indicates whether the slope of the regression line is positive or negative 0 measures the percentage of variation explained by the regression line QUESTION 44 Use computer software to obtain the multiple regression equation and identify Re, adjusted Re, and the P-value. An anti-smoking group used data in the table to relate the carbon monoxide (CO) of various brands of cigarettes to their tar and nicotine (NIC) content. CO TAR NIC 15 1.2 16 15 1.2 16 17 1.0 16 6 0.8 9 1 0.1 1 8 0.8 8 10 0.8 10 17 1.0 16 15 1.2 15 11 0.7 9 18 1.4 18 16 1.0 15 10 0.8 9 7 0.5 5 18 1.1 16 0.943, 0.934, 0.000 0.931, 0.902, 0.000 0.861, 0.900, 0.015 0.976, 0.921, 0.002QUESTION 46 Use the following regression results to answer the question below. Regression Statistics Multiple R 0.8851 R Square 0.7835 Adjusted R Square 0.7474 Standard Error 5.4006 Observations 8 ANOVA SS MS F Regression 633.242 633.242 21.711 Residual 175.000 29.167 Total 808.242 Coefficients Standard Enor + Stat P-value Intercept 5.93118 4.17721 1.41989 0.20545 Total Bill -2.71551 0.58279 -4.65952 0.00347 Which of the following is true? O x explains about 78.4 percent of the variation in y. O y explains about $8.5 percent of the variation in x. O y explains about 78.4 percent of the variation in X. O x explains about 88.5 percent of the variation in y.QUESTION 45 Use the following regression results to answer the question below. Regression Statistics Multiple R 0.8851 R Square 0.7835 Adjusted R Square 0.7474 Standard Error 5.4006 Observations 8 ANOVA SS MS F Regression 633.242 633.242 21.711 Residual 6 175.000 29.167 Total 808.242 Coefficients Standard Enor t Stat P-value Intercept 5.93118 4.17721 1.41989 0.20545 Total Bill -2.71551 0.58279 -4.65952 0.00347 Which of the following is true? The correlation between x and y must be approximately -0.8851. The correlation between x and y must be approximately -0.7835. The correlation between x and y must be approximately 0.7835. O The correlation between x and y must be approximately 0.8851.QUESTION 49 Using the same data set, four models are estimated using the same response variable, however, the number of explanatory variables differs. Which of the following models provides the best fit? Model 1 Model 2 Model 3 Model 4 Multiple R 0.993 0.991 0.936 0.746 R Square 0.987 0.982 0.877 0.557 Adjusted R Square 0.982 0.978 0.849 0.513 Standard Error 4,043 4,463 11,615 20,878 Observations 12 12 12 12 O Model 1 O Model 2 O Model 3 O Model 4QUESTION 50 When estimating Y'= bo+ bqx1+ b2x2, the following regression results using ANOVA were obtained. df SS MS F Regression 2 210.9 105.5 114.7 Residual 17 15.6 0.92 Total 19 226.5 Coefficients Standard Error t-stat p-value Intercept -1.6 0.57 -2.77 0.0132 X1 -0.5 0.04 -15.11 2.77E-11 X2 0. 1 0.07 1.89 0.0753 Which of the following is the prediction of Y if x 1 = 1 and x 2 = 2? O -1.9 O 1.9 O 1.3 O -0.3
Step by Step Solution
There are 3 Steps involved in it

Get step-by-step solutions from verified subject matter experts


