

Answered step by step
Verified Expert Solution
Question
1 Approved Answer
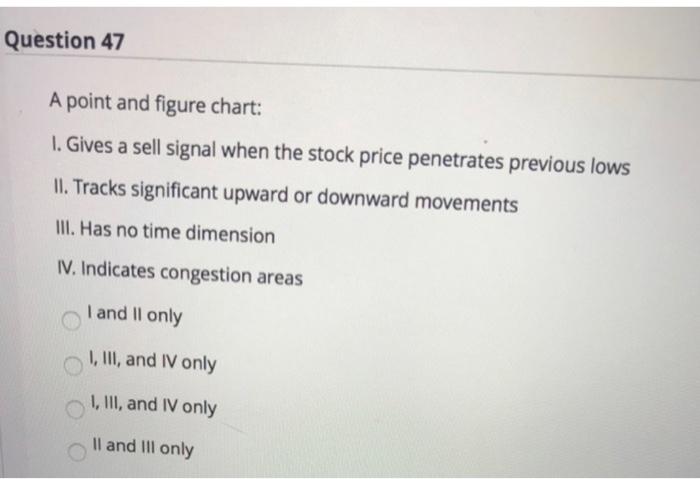
Question 47 A point and figure chart: 1. Gives a sell signal when the stock price penetrates previous lows II. Tracks significant upward or downward
Step by Step Solution
There are 3 Steps involved in it
Step: 1

Get Instant Access to Expert-Tailored Solutions
See step-by-step solutions with expert insights and AI powered tools for academic success
Step: 2

Step: 3
Ace Your Homework with AI
Get the answers you need in no time with our AI-driven, step-by-step assistance
Get Started
Technology And Finance Challenges For Financial Markets Business Strategies And Policy Makers
Authors: Morten Balling, Frank Lierman, Andy Mullineux
1st Edition
041529827X, 978-0415298278