Answered step by step
Verified Expert Solution
Link Copied!

Question

1 Approved Answer

Question 4C and D. U.S. Civilian Labor Force, 2007-2016 Year Labor Force 2007 153,918 2008 154,655 2009 153,111 2010 153,650 2011 153,995 2012 155,628 2013

Question 4C and D.
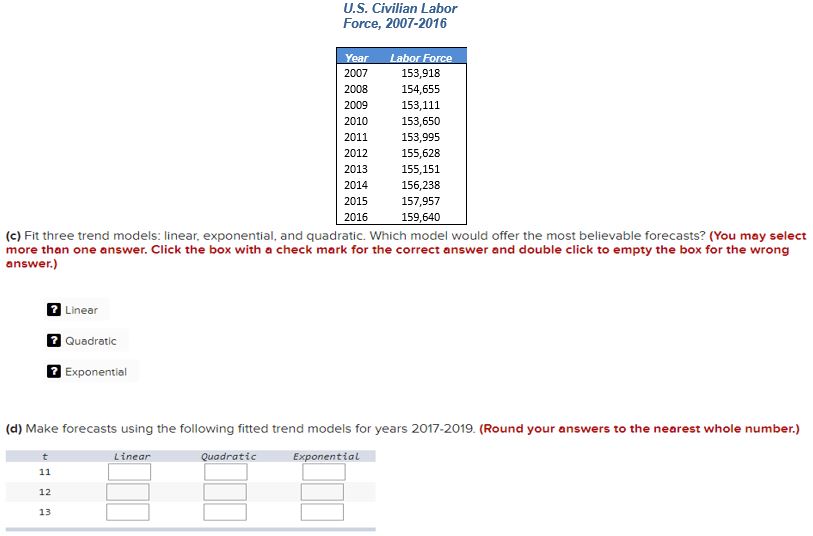
image text in transcribed
U.S. Civilian Labor Force, 2007-2016 Year Labor Force 2007 153,918 2008 154,655 2009 153,111 2010 153,650 2011 153,995 2012 155,628 2013 155,151 2014 156,238 2015 157,957 2016 159,640 (c) Fit three trend models: linear, exponential, and quadratic. Which model would offer the most believable forecasts? (You may select more than one answer. Click the box with a check mark for the correct answer and double click to empty the box for the wrong answer.) 7 Linear 7 Quadratic 7 Exponential (d) Make forecasts using the following fitted trend models for years 2017-2019. (Round your answers to the nearest whole number.) t Linear Quadratic Exponential 11 12 13

Step by Step Solution

There are 3 Steps involved in it

Step: 1

blur-text-image

Get Instant Access to Expert-Tailored Solutions

See step-by-step solutions with expert insights and AI powered tools for academic success

Step: 2

blur-text-image

Step: 3

blur-text-image

Ace Your Homework with AI

Get the answers you need in no time with our AI-driven, step-by-step assistance

Get Started

Recommended Textbook for

Precalculus Enhanced With Graphing Utilities (Subscription)

Authors: Michael, Michael Sullivan III, Michael III Sullivan, III Sullivan

6th Edition

0321849108, 9780321849106

More Books

Students also viewed these Mathematics questions

Question

7. Identify four antecedents that influence intercultural contact.

Answered: 1 week ago

Question

5. Describe the relationship between history and identity.

Answered: 1 week ago