

Answered step by step
Verified Expert Solution
Question
1 Approved Answer
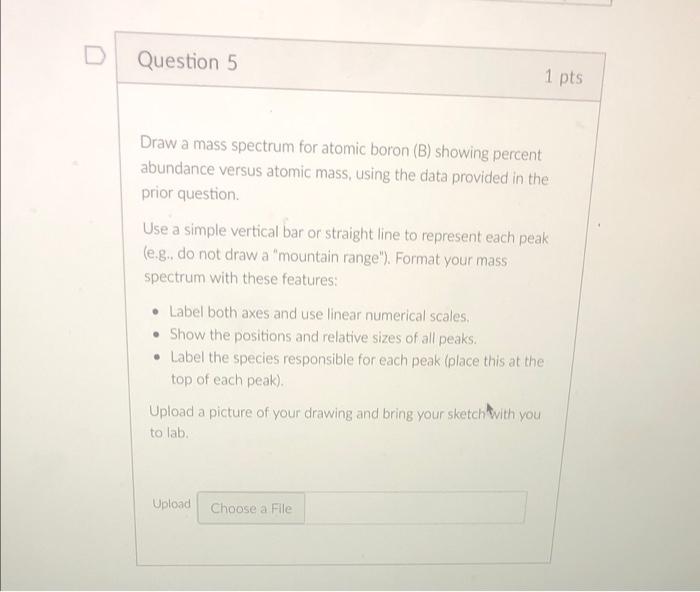
Question 5 1 pts Draw a mass spectrum for atomic boron (B) showing percent abundance versus atomic mass, using the data provided in the prior
Step by Step Solution
There are 3 Steps involved in it
Step: 1

Get Instant Access to Expert-Tailored Solutions
See step-by-step solutions with expert insights and AI powered tools for academic success
Step: 2

Step: 3
Ace Your Homework with AI
Get the answers you need in no time with our AI-driven, step-by-step assistance
Get Started
Introduction To Chemical Engineering For Chemical Engineers And Students
Authors: Uche P. Nnaji
1st Edition
1119592100, 978-1119592105