 Question 5
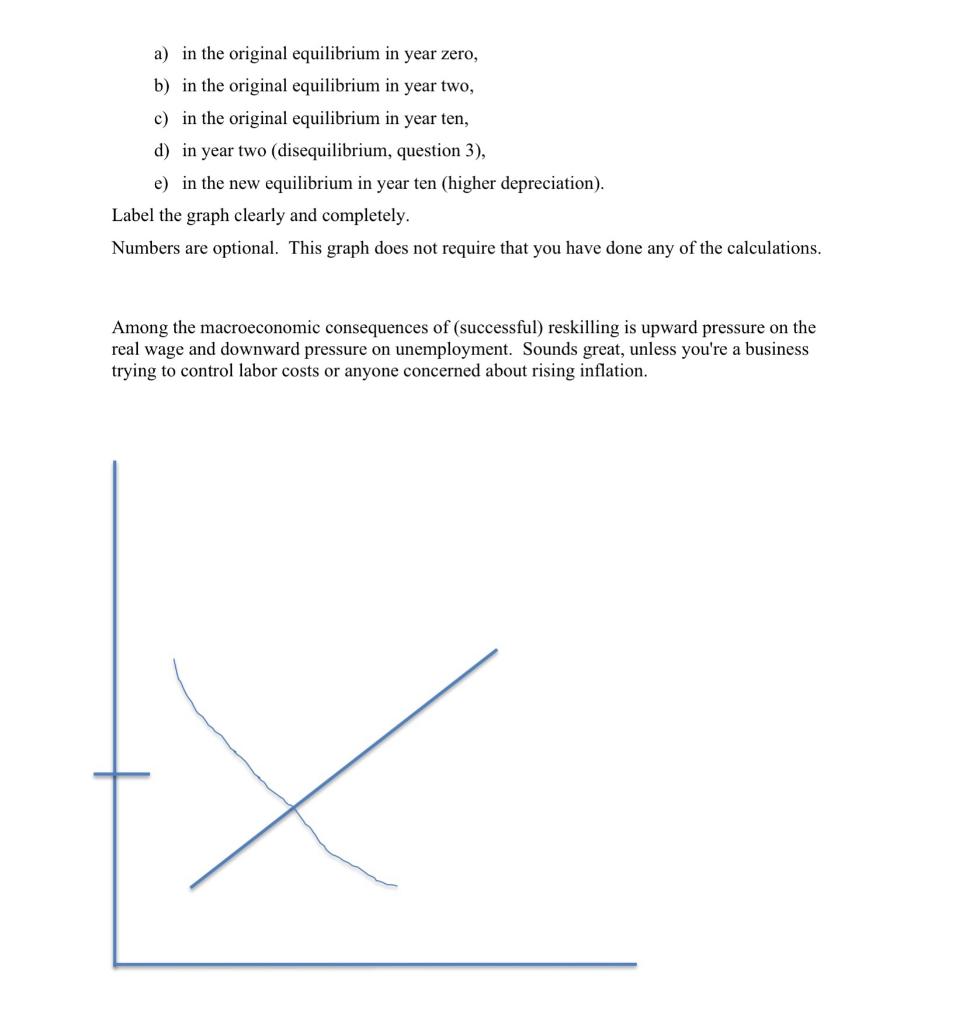
Once upon a time, young and old (retired) lived together with their parents and children (i.e., the producer/earners). Using neither financial markets nor assets, the earners make intertemporal (consumption smoothing) choices. Each unit of "saving" by the earners has a benefit, the size of which is chosen by the young (in the future, when they have become earners). Consumption by the young affects their future ability to produce, and the example of their parents sharing with their grandparents affects the young's willingness to share with their retired parents. 1. On a single graph of intertemporal choice, show two scenarios: a) Each unit of consumption by the young increases their future earnings. b) Beyond some low level of consumption by the young, additional consumption (by the young) has no effect on their future earnings. Label the graph clearly and completely. Given the production function, y = kA1-a assume that the economy is in equilibrium in year zero with s= 0.25 SL = 0.02 a= 1/3 8=0.08 ko=$2000 84 = 0.02 2. Calculate the level of output per worker in year ten. [Round your answer to the nearest hundredth.] Suppose that the capital stock in place in year zero depreciates at twelve percent (rather than eight percent) and this higher rate of depreciation is permanent. 3. Calculate the level of output per worker in year two. K Y =Y 9L+gA+8 kt = = (4)(1/1-2 x A yz = (*)(1-0) * A kt = kt-1(1 - 8 - 9.) + syt-1 9yt = aGkt + (1 - a)ga Xt+j = x(1 + 9x) 9x = Xt-xt-1 Xt-1 Ct = y(1-3) 4. On one k-y graph, show the economy a) in the original equilibrium in year zero, b) in the original equilibrium in year two, c) in the original equilibrium in year ten, d) in year two (disequilibrium, question 3), e) in the new equilibrium in year ten (higher depreciation). Label the graph clearly and completely. Numbers are optional. This graph does not require that you have done any of the calculations. Among the macroeconomic consequences of (successful) reskilling is upward pressure on the real wage and downward pressure on unemployment. Sounds great, unless you're a business trying to control labor costs or anyone concerned about rising inflation. 5. On the labor market graph above, show a) reskilling, b) then, offshoring The reskilling is not removed; offshoring is an added feature. Slopes never change. Label the graph clearly and completely, including unemployment. The aggregate supply curve and aggregate demand curve A = 1 +7(Y Y')+p = 8 have parameter values: y = 0.05, 8 = 286, 0 = 12, and y? = 250. Assume that when curves shift, the slopes never change. In each year, expected inflation is updated to equal last year's inflation. Exogenous changes are permanent. This economy is in long-run equilibrium in year zero. In year one, policymakers launch a reskilling program of substantial investments in education and worker training. d rises to 320. [In this model, 8 is "demand conditions," not depreciation.] 6. Calculate the values of output and inflation in year two. [Round inflation to the nearest hundredth of a percentage point and round output to the nearest hundredth.] By year three, the combination of rising inflation and demand for imports has convinced global bond markets to lower the expected nominal exchange rate. The actual nominal exchange rate declines accordingly, so rises above 320. Under these circumstances, the economy cannot reach a long-run equilibrium. Escape from the spiral of demand stimulus - inflation - depreciation (which is a demand stimulus) is possible only if (1) the reskilling program is abandoned, or (2) the reskilling program succeeds in raising potential output. 7. On a graph of aggregate demand and aggregate supply, show this economy in years zero through three, and in both versions of the new long-run equilibrium. [Numbers are optional. Label the graph clearly and completely.]