Answered step by step
Verified Expert Solution
Link Copied!

Question

1 Approved Answer

Question 6 1 p Suppose the age distribution of the Canadian population and the age distribution of a random sample of 542 residents in the
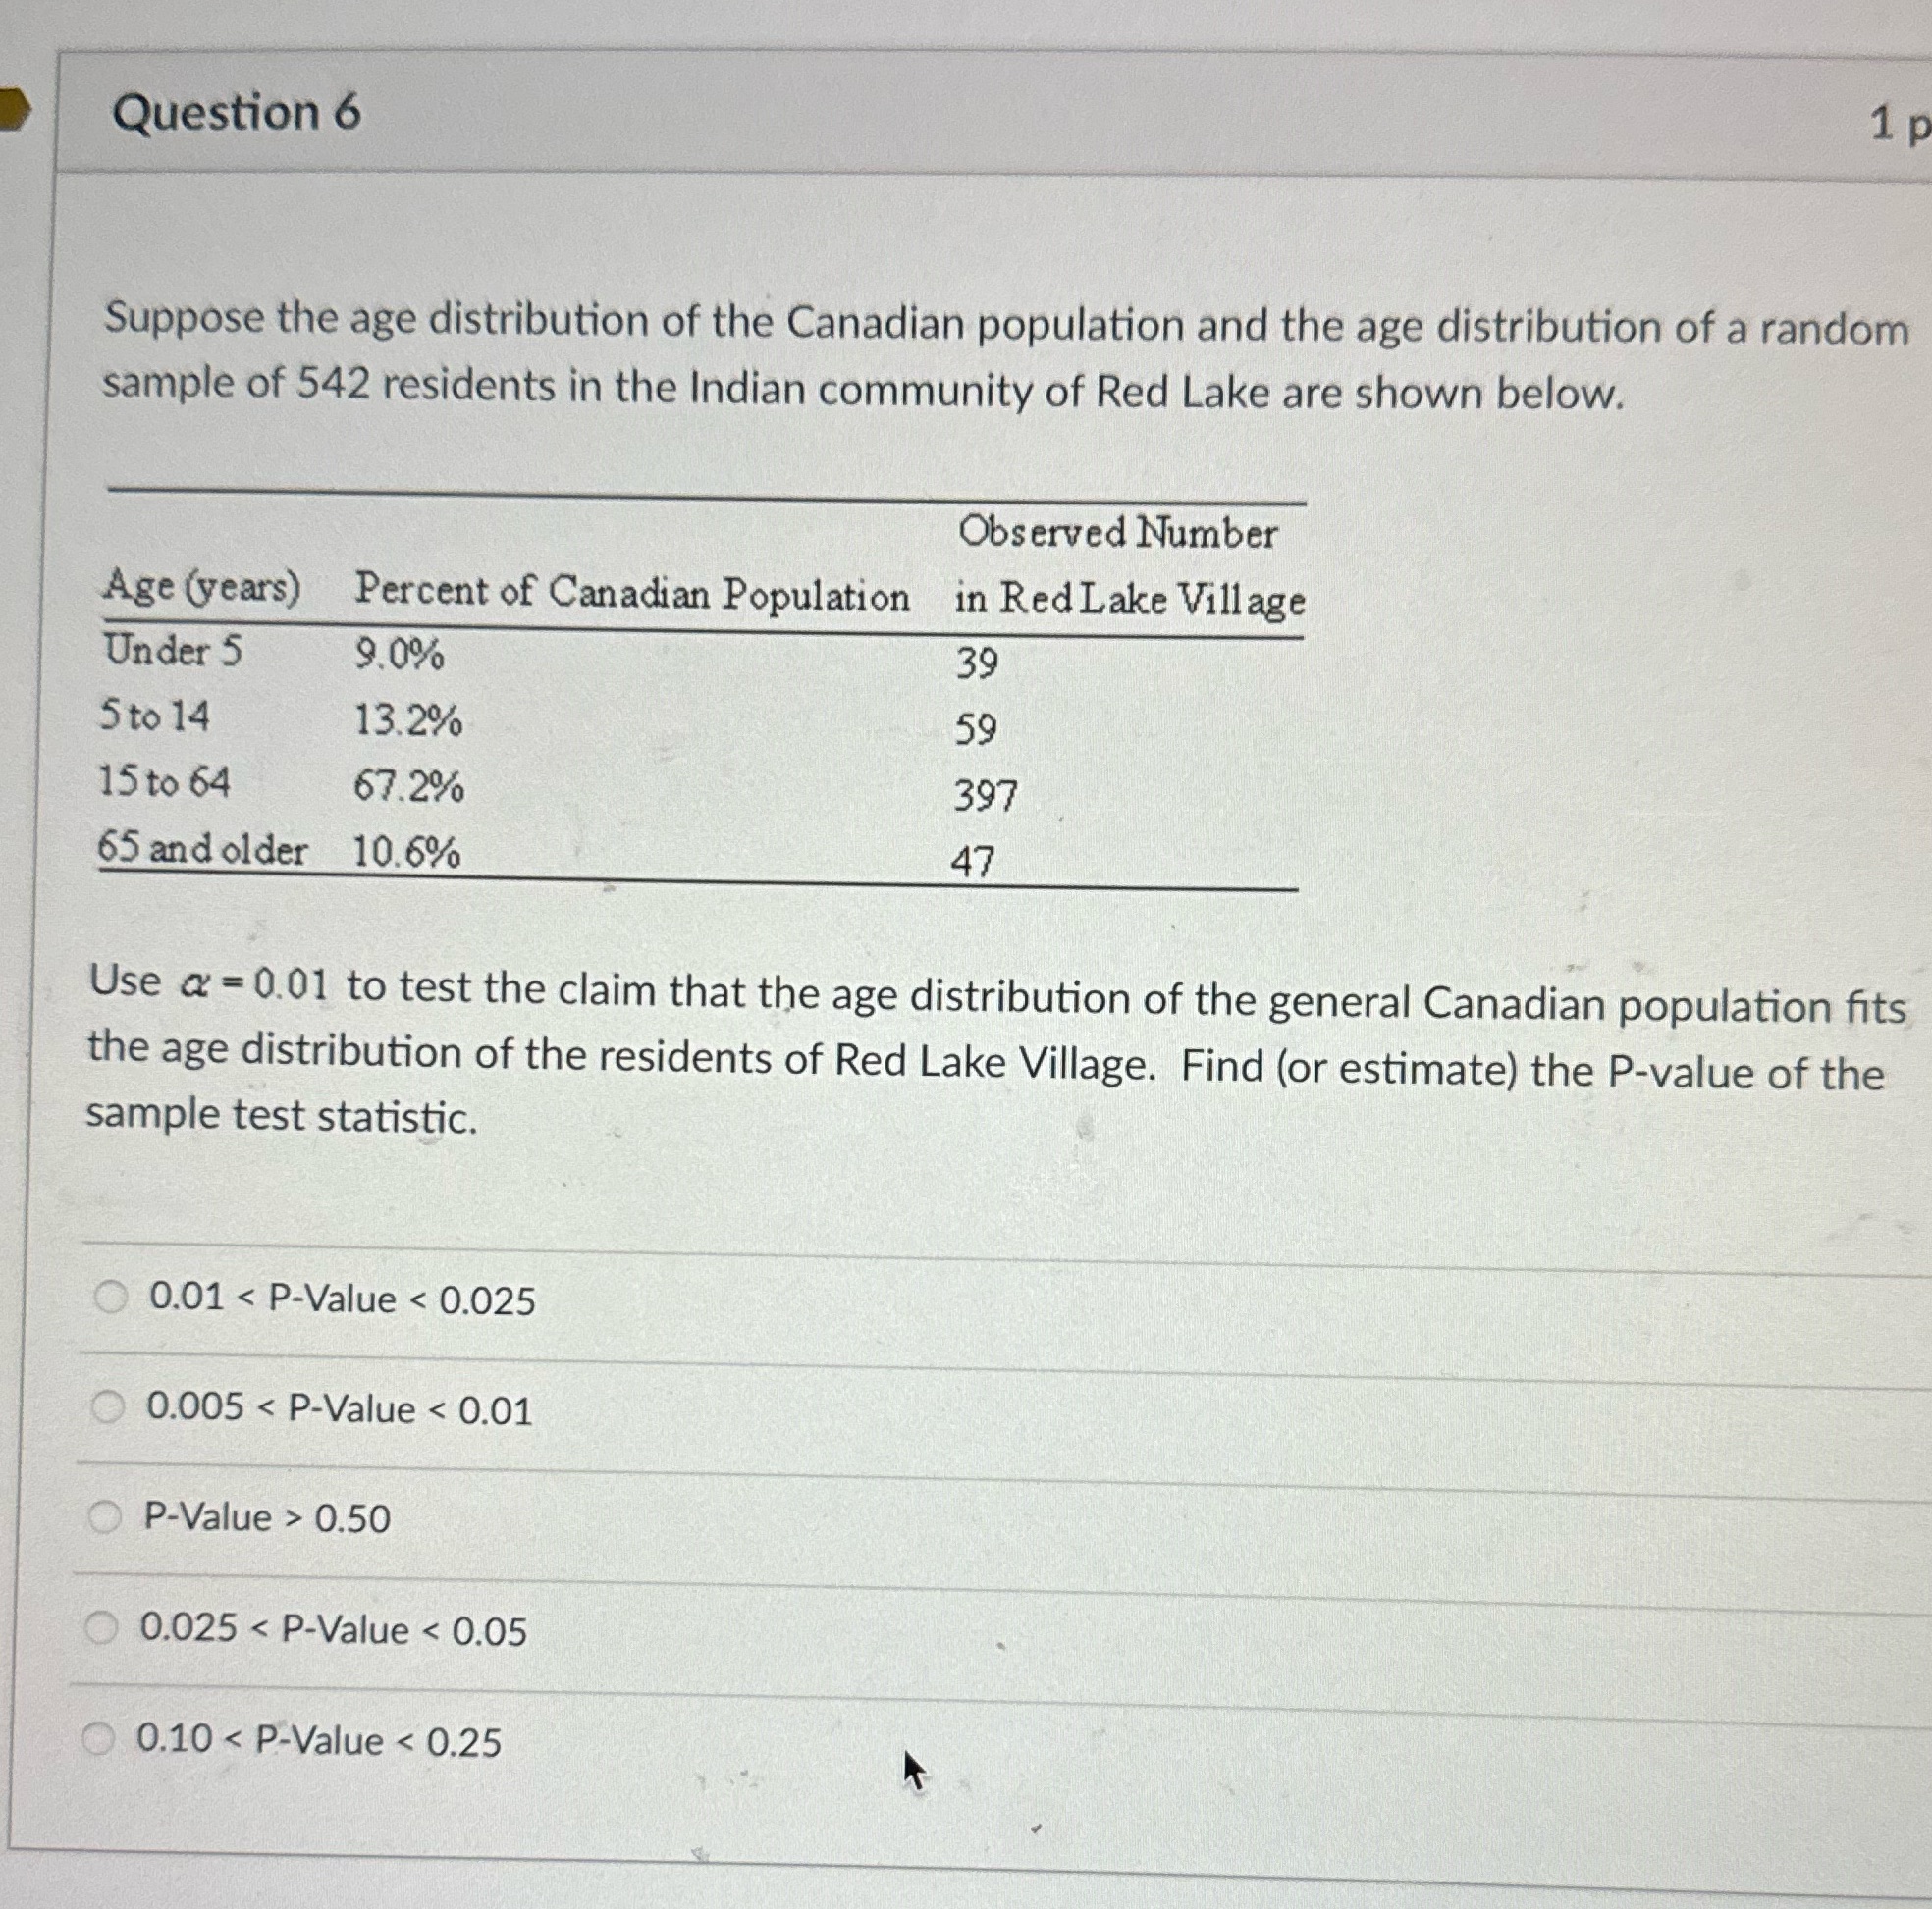
image text in transcribed
Question 6 1 p Suppose the age distribution of the Canadian population and the age distribution of a random sample of 542 residents in the Indian community of Red Lake are shown below. Observed Number Age (years) Percent of Canadian Population in Red Lake Village Under 5 9.0% 39 5 to 14 13.2% 59 15 to 64 67.2% 397 65 and older 10.6% 47 Use a = 0.01 to test the claim that the age distribution of the general Canadian population fits the age distribution of the residents of Red Lake Village. Find (or estimate) the P-value of the sample test statistic. 0.01 0.50 0.025

Step by Step Solution

There are 3 Steps involved in it

Step: 1

blur-text-image

Get Instant Access to Expert-Tailored Solutions

See step-by-step solutions with expert insights and AI powered tools for academic success

Step: 2

blur-text-image

Step: 3

blur-text-image

Ace Your Homework with AI

Get the answers you need in no time with our AI-driven, step-by-step assistance

Get Started

Recommended Textbook for

Fundamentals Of Business Mathematics In Canada

Authors: F. Ernest Jerome, Jackie Shemko

3rd Edition

1259370151, 978-1259370151

More Books

Students also viewed these Mathematics questions

Question

Q.No.1 Explain Large scale map ? Q.No.2 Explain small scale map ?

Answered: 1 week ago

Question

1. Signs and symbols of the map Briefly by box ?

Answered: 1 week ago