

Answered step by step
Verified Expert Solution
Question
1 Approved Answer
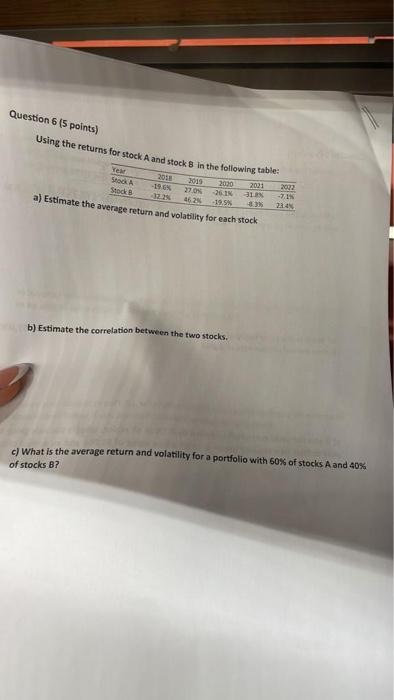
Question 6 (5 points) Using the returns for stock A and stock B in the following table: 2018 -19.6% -32.2% a) Estimate the average return
Question 6 (5 points) Using the returns for stock A and stock B in the following table: 2018 -19.6% -32.2% a) Estimate the average return and volatility for each stock of puppies Year Stock A Stock B 2019 2020 2021 2022 -31.8% -7.1% 27.0% -26.1% 46.2% -19.5% -8.3% 23.4% b) Estimate the correlation between the two stocks. c) What is the average return and volatility for a portfolio with 60% of stocks A and 40% of stocks B?
Step by Step Solution
There are 3 Steps involved in it
Step: 1

Get Instant Access to Expert-Tailored Solutions
See step-by-step solutions with expert insights and AI powered tools for academic success
Step: 2

Step: 3
Ace Your Homework with AI
Get the answers you need in no time with our AI-driven, step-by-step assistance
Get Started
A Good Financial Advisor Will Tell You Everything You Need To Know About Retirement Generating Lifetime Income And Planning Your Legacy
Authors: Jeremy A. Kisner CFP, Robert J. Luna CIMA
1st Edition
1935586491, 978-1935586494