

Answered step by step
Verified Expert Solution
Question
1 Approved Answer
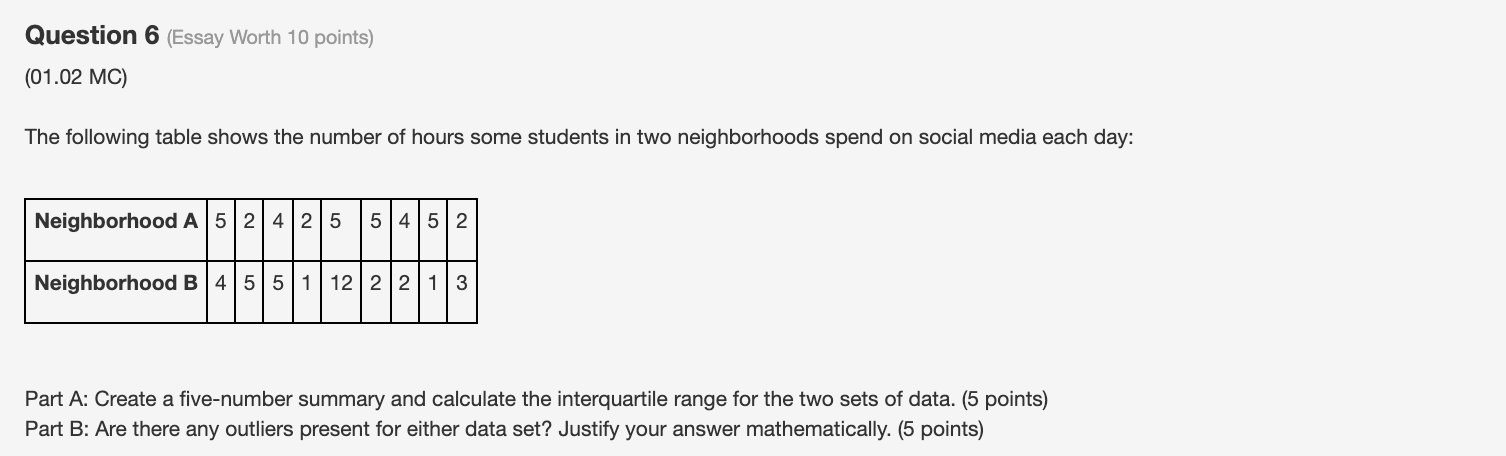
Question 6 (Essay Worth 10 points) (01.02 MC) The following table shows the number of hours some students in two neighborhoods spend on social media
Step by Step Solution
There are 3 Steps involved in it
Step: 1

Get Instant Access to Expert-Tailored Solutions
See step-by-step solutions with expert insights and AI powered tools for academic success
Step: 2

Step: 3
Ace Your Homework with AI
Get the answers you need in no time with our AI-driven, step-by-step assistance
Get Started