Answered step by step
Verified Expert Solution
Link Copied!

Question

1 Approved Answer

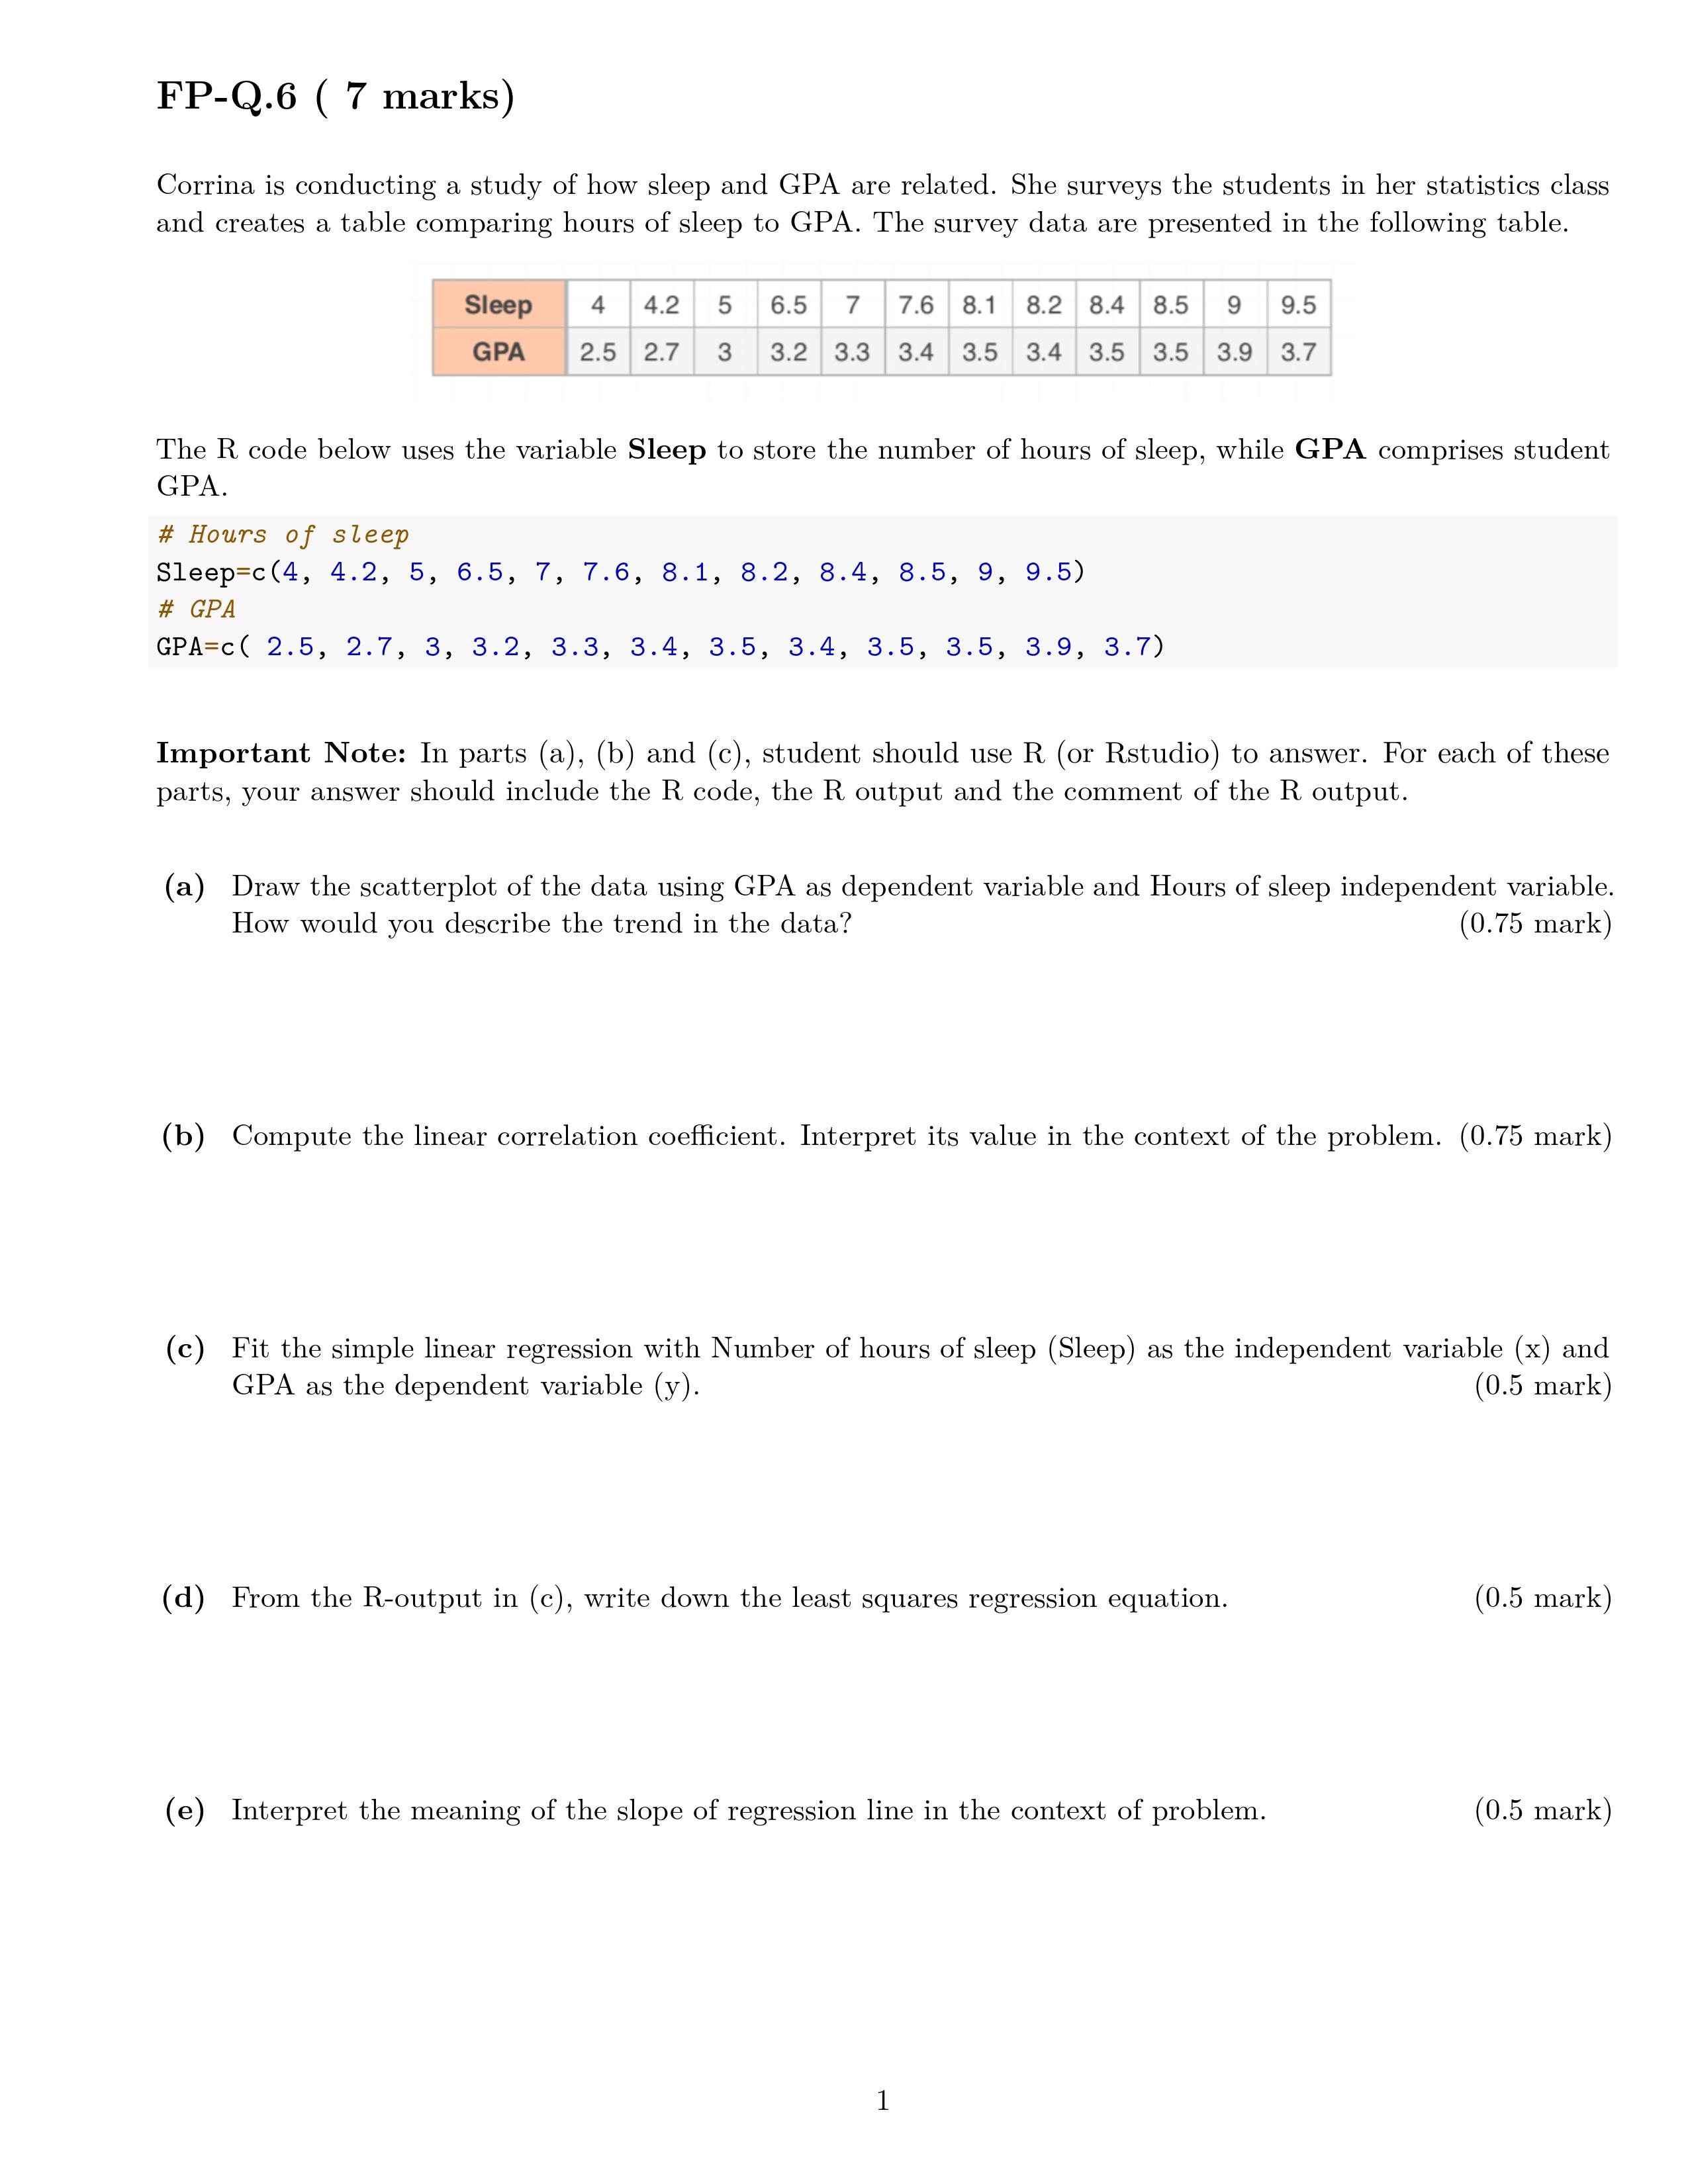
question 6 r coding needed FP-Q.6 ( 7 marks) Corrina is conducting a study of how sleep and GPA are related. She surveys the students

question 6 r coding needed

image text in transcribedimage text in transcribed
FP-Q.6 ( 7 marks) Corrina is conducting a study of how sleep and GPA are related. She surveys the students in her statistics class and creates a table comparing hours of sleep to GPA. The survey data are presented in the following table. Sloop GPA 4 (4.2 5 6.5 7 7.6 3.1 3.2 8.4 8.5 9 9.5} 2.5'27 3 3.2 3.3 3.4 3.5 3.4 3.5 3.5 3.9 3.7 The R code below uses the variable Sleep to store the number of hours of sleep, while GPA comprises student GPA. # Hours of sleep S1eep=c(4, 4.2, 5, 6.5, 7, 7.6, 8.1, 8.2, 8.4, 8.5, 9, 9.5) # GPA GPA=c( 2.5, 2.7, 3, 3.2, 3.3, 3.4, 3.5, 3.4, 3.5, 3.5, 3.9, 3.7) Important Note: In parts (a), (b) and (c), student should use R (or Rstudio) to answer. For each of these parts, your answer should include the R code, the R output and the comment of the R output. (a) Draw the scatterplot of the data using GPA as dependent variable and Hours of sleep independent variable. How would you describe the trend in the data? (0.75 mark) (b) Compute the linear correlation coefcient. Interpret its value in the context of the problem. (0.75 mark) (C) Fit the simple linear regression with Number of hours of sleep (Sleep) as the independent variable (X) and GPA as the dependent variable (y). (0.5 mark) ((1) From the Routput in (c), write down the least squares regression equation. (0.5 mark) (9) Interpret the meaning of the slope of regression line in the context of problem. (0.5 mark) (f) Test, at the 10% level of significance, the hypothesis that the slope of the population regression line is different from 0, against the null hypothesis that it is exactly 0. Report the value of the t-test statistic, the degrees of freedom, the p-value and your conclusion. (1.5 marks) (g) Calculate a 95% confidence interval for the population slope. (1 mark) (h) Find and interpret the coefficient of determination. (1 mark) (i) Estimate the GPA of a student who sleep 10 hours. 0.5 mark) 2

Step by Step Solution

There are 3 Steps involved in it

Step: 1

blur-text-image

Get Instant Access to Expert-Tailored Solutions

See step-by-step solutions with expert insights and AI powered tools for academic success

Step: 2

blur-text-image

Step: 3

blur-text-image

Ace Your Homework with AI

Get the answers you need in no time with our AI-driven, step-by-step assistance

Get Started

Recommended Textbook for

Elementary Algebra

Authors: Charles P McKeague

2nd Edition

1483263819, 9781483263816

More Books

Students also viewed these Mathematics questions

Question

Apply your own composing style to personalize your messages.

Answered: 1 week ago

Question

Format memos and e-mail properly.

Answered: 1 week ago