 '
'
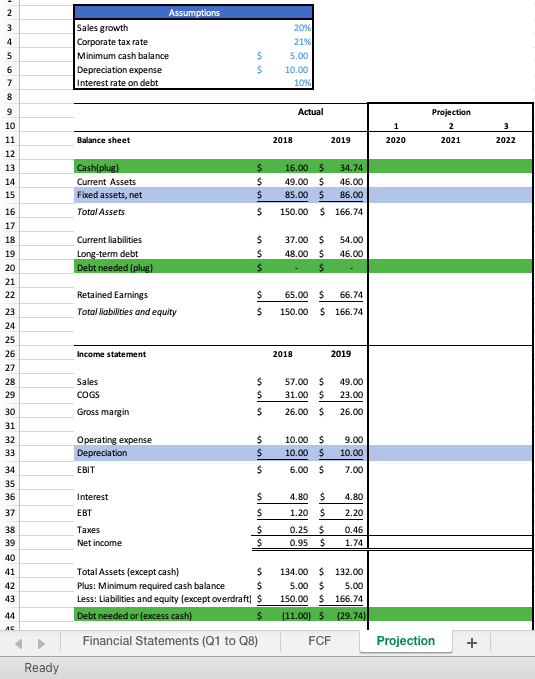
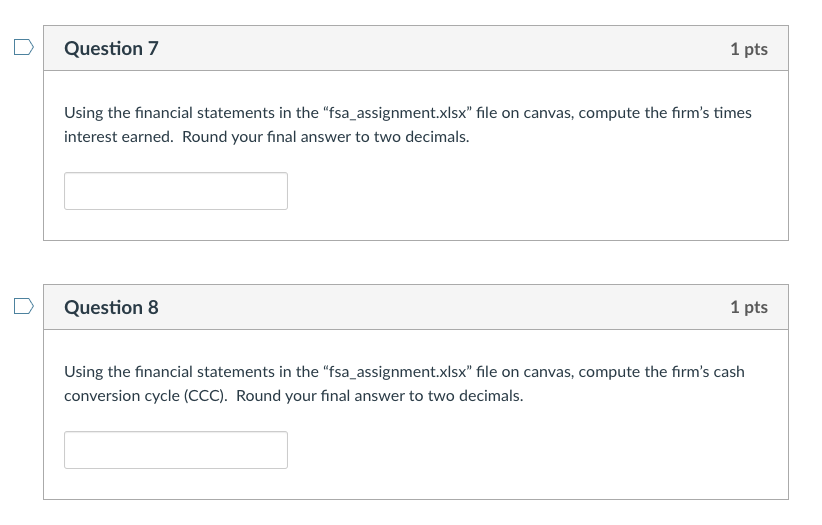
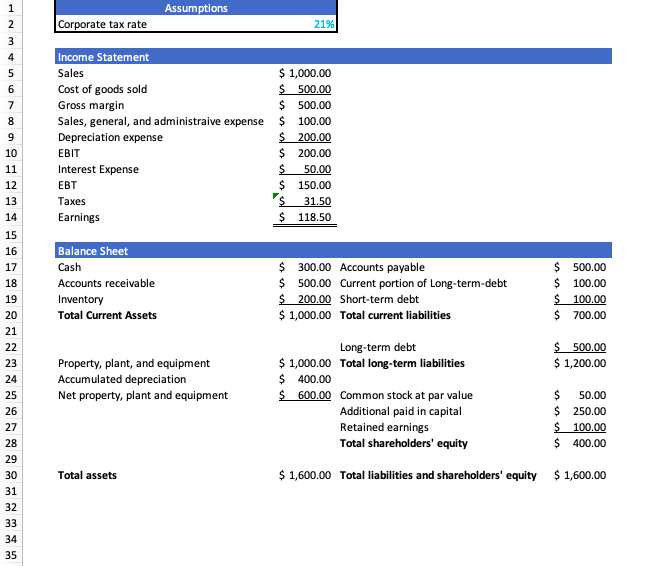
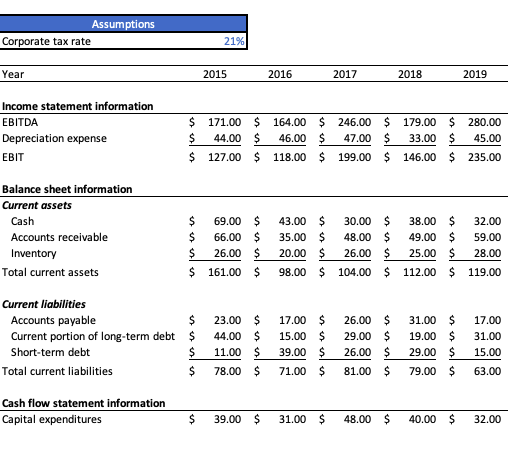
Question 7 1 pts Using the financial statements in the "fsa_assignment.xlsx" file on canvas, compute the firm's times interest earned. Round your final answer to two decimals. Question 8 1 pts Using the financial statements in the "fsa_assignment.xlsx" file on canvas, compute the firm's cash conversion cycle (CCC). Round your final answer to two decimals. Assumptions Corporate tax rate 21% 1 2 3 4 5 6 7 8 9 10 11 12 13 14 Income Statement Sales $ 1,000.00 Cost of goods sold $ 500.00 Gross margin $ 500.00 Sales, general, and administraive expense $ 100.00 Depreciation expense $ 200.00 EBIT $ 200.00 Interest Expense $ 50.00 EBT $ 150.00 Taxes 31.50 Earnings $ 118.50 15 16 17 18 Balance Sheet Cash Accounts receivable Inventory Total Current Assets $ 300.00 Accounts payable $ 500.00 Current portion of Long-term-debt $ 200.00 Short-term debt $ 1,000.00 Total current liabilities $ 500.00 $ 100.00 $ 100.00 $ 700.00 $ 500.00 $ 1,200.00 Property, plant, and equipment Accumulated depreciation Net property, plant and equipment 19 20 21 22 23 24 25 26 27 28 29 30 31 32 33 34 35 Long-term debt $ 1,000.00 Total long-term liabilities $ 400.00 $ 600.00 Common stock at par value Additional paid in capital Retained earnings Total shareholders' equity $ 50.00 $ 250.00 $ 100.00 $ 400.00 Total assets $ 1,600.00 Total liabilities and shareholders' equity $1,600.00 Assumptions Corporate tax rate 21% Year 2015 2016 2017 2018 2019 Income statement information EBITDA Depreciation expense EBIT $ 171.00 $ 44.00 $ 127.00 $ 164.00 $ 246.00 $ 179.00 $ 280.00 $ 46.00 $ 47.00 $ 33.00 $ 45.00 $ 118.00 $ 199.00 $ 146.00 $ 235.00 Balance sheet information Current assets Cash Accounts receivable Inventory Total current assets $ 69.00 $ 43.00 $ 30.00 $ 38.00 $ 32.00 $ 66.00 $ 35.00 $ 48.00 $ 49.00 $ 59.00 $ 26.00 $ 20.00 $ 26.00 $ 25.00 $ 28.00 $ 161.00 $ 98.00 $ 104.00 $ 112.00 $ 119.00 Current liabilities Accounts payable $ Current portion of long-term debt $ Short-term debt $ Total current liabilities $ 23.00 $ 44.00 $ 11.00 $ 78.00 $ 17.00 $ 15.00 $ 39.00 $ 71.00 $ 26.00 $ 29.00 $ 26.00 $ 81.00 $ 31.00 $ 19.00 $ 29.00 $ 79.00 $ 17.00 31.00 15.00 63.00 Cash flow statement information Capital expenditures $ 39.00 $ 31.00 $ 48.00 $ 40.00 $ 32.00 2 3 4 Assumptions Sales growth Corporate tax rate Minimum cash balance Depreciation expense Interest rate on debt 5 $ $ 20% 21% 5.00 10.00 10% 6 7 8 9 Actual 10 1 2020 Projection 2 2021 11 Balance sheet 2018 2019 2022 12 13 14 Cash[plug) Current Assets Fixed assets, net Total Assets $ $ $ $ 16.00 $ 34.74 49.00 $ 46.00 85.00 $ 86.00 150.00 $ 166.74 15 16 17 18 Current liabilities Long-term debt Debt needed (plug) $ $ $ 37.00 $ 48.00 $ $ 54.00 46.00 19 20 21 22 $ Retained Earnings Total liabilities and equity 65.00 $ 66.74 150.00 $ 166.74 23 $ 24 25 Income statement 2018 2019 26 27 28 29 Sales COGS Gross margin $ $ 57.00 $ 31.00 $ 26.00 $ 49.00 23.00 $ 26.00 30 31 32 33 Operating expense Depreciation EBIT $ $ $ 10.00 $ 10.00 $ 6.00 $ 9.00 10.00 34 7.00 35 36 37 Interest 4.80 2.20 $ $ $ $ 4.80 $ 1.20 $ 0.25$ 0.95 $ 38 39 Taxes Net income 0.46 1.74 40 41 $ $ 42 Total Assets (except cash) Plus: Minimum required cash balance Less: Liabilities and equity (except overdraft) $ Debt needed or (excess cash) $ Financial Statements (Q1 to 28) 134.00 $ 132.00 5.00 $ 5.00 150.00 $ 166.74 (11.00) 129.74) 43 44 AE FCF Projection + Ready Question 7 1 pts Using the financial statements in the "fsa_assignment.xlsx" file on canvas, compute the firm's times interest earned. Round your final answer to two decimals. Question 8 1 pts Using the financial statements in the "fsa_assignment.xlsx" file on canvas, compute the firm's cash conversion cycle (CCC). Round your final answer to two decimals. Assumptions Corporate tax rate 21% 1 2 3 4 5 6 7 8 9 10 11 12 13 14 Income Statement Sales $ 1,000.00 Cost of goods sold $ 500.00 Gross margin $ 500.00 Sales, general, and administraive expense $ 100.00 Depreciation expense $ 200.00 EBIT $ 200.00 Interest Expense $ 50.00 EBT $ 150.00 Taxes 31.50 Earnings $ 118.50 15 16 17 18 Balance Sheet Cash Accounts receivable Inventory Total Current Assets $ 300.00 Accounts payable $ 500.00 Current portion of Long-term-debt $ 200.00 Short-term debt $ 1,000.00 Total current liabilities $ 500.00 $ 100.00 $ 100.00 $ 700.00 $ 500.00 $ 1,200.00 Property, plant, and equipment Accumulated depreciation Net property, plant and equipment 19 20 21 22 23 24 25 26 27 28 29 30 31 32 33 34 35 Long-term debt $ 1,000.00 Total long-term liabilities $ 400.00 $ 600.00 Common stock at par value Additional paid in capital Retained earnings Total shareholders' equity $ 50.00 $ 250.00 $ 100.00 $ 400.00 Total assets $ 1,600.00 Total liabilities and shareholders' equity $1,600.00 Assumptions Corporate tax rate 21% Year 2015 2016 2017 2018 2019 Income statement information EBITDA Depreciation expense EBIT $ 171.00 $ 44.00 $ 127.00 $ 164.00 $ 246.00 $ 179.00 $ 280.00 $ 46.00 $ 47.00 $ 33.00 $ 45.00 $ 118.00 $ 199.00 $ 146.00 $ 235.00 Balance sheet information Current assets Cash Accounts receivable Inventory Total current assets $ 69.00 $ 43.00 $ 30.00 $ 38.00 $ 32.00 $ 66.00 $ 35.00 $ 48.00 $ 49.00 $ 59.00 $ 26.00 $ 20.00 $ 26.00 $ 25.00 $ 28.00 $ 161.00 $ 98.00 $ 104.00 $ 112.00 $ 119.00 Current liabilities Accounts payable $ Current portion of long-term debt $ Short-term debt $ Total current liabilities $ 23.00 $ 44.00 $ 11.00 $ 78.00 $ 17.00 $ 15.00 $ 39.00 $ 71.00 $ 26.00 $ 29.00 $ 26.00 $ 81.00 $ 31.00 $ 19.00 $ 29.00 $ 79.00 $ 17.00 31.00 15.00 63.00 Cash flow statement information Capital expenditures $ 39.00 $ 31.00 $ 48.00 $ 40.00 $ 32.00 2 3 4 Assumptions Sales growth Corporate tax rate Minimum cash balance Depreciation expense Interest rate on debt 5 $ $ 20% 21% 5.00 10.00 10% 6 7 8 9 Actual 10 1 2020 Projection 2 2021 11 Balance sheet 2018 2019 2022 12 13 14 Cash[plug) Current Assets Fixed assets, net Total Assets $ $ $ $ 16.00 $ 34.74 49.00 $ 46.00 85.00 $ 86.00 150.00 $ 166.74 15 16 17 18 Current liabilities Long-term debt Debt needed (plug) $ $ $ 37.00 $ 48.00 $ $ 54.00 46.00 19 20 21 22 $ Retained Earnings Total liabilities and equity 65.00 $ 66.74 150.00 $ 166.74 23 $ 24 25 Income statement 2018 2019 26 27 28 29 Sales COGS Gross margin $ $ 57.00 $ 31.00 $ 26.00 $ 49.00 23.00 $ 26.00 30 31 32 33 Operating expense Depreciation EBIT $ $ $ 10.00 $ 10.00 $ 6.00 $ 9.00 10.00 34 7.00 35 36 37 Interest 4.80 2.20 $ $ $ $ 4.80 $ 1.20 $ 0.25$ 0.95 $ 38 39 Taxes Net income 0.46 1.74 40 41 $ $ 42 Total Assets (except cash) Plus: Minimum required cash balance Less: Liabilities and equity (except overdraft) $ Debt needed or (excess cash) $ Financial Statements (Q1 to 28) 134.00 $ 132.00 5.00 $ 5.00 150.00 $ 166.74 (11.00) 129.74) 43 44 AE FCF Projection + Ready