

Answered step by step
Verified Expert Solution
Question
1 Approved Answer
Question A (40%) Write a MATLAB/Octave script that draws a graph of the population of the USA from 1790 to 2000, using the (logistic) model:
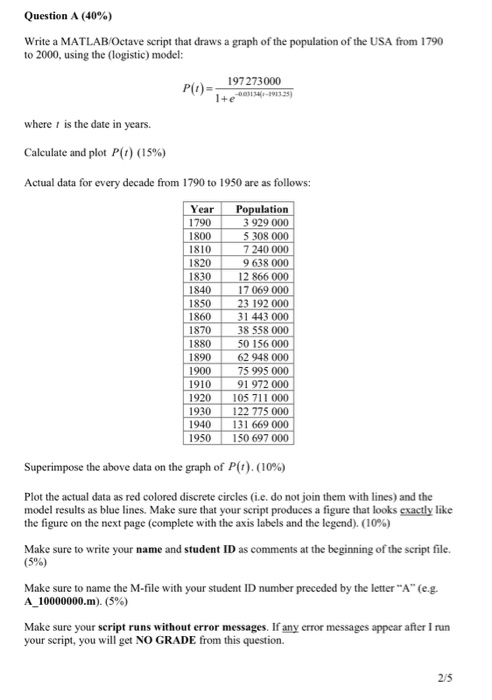
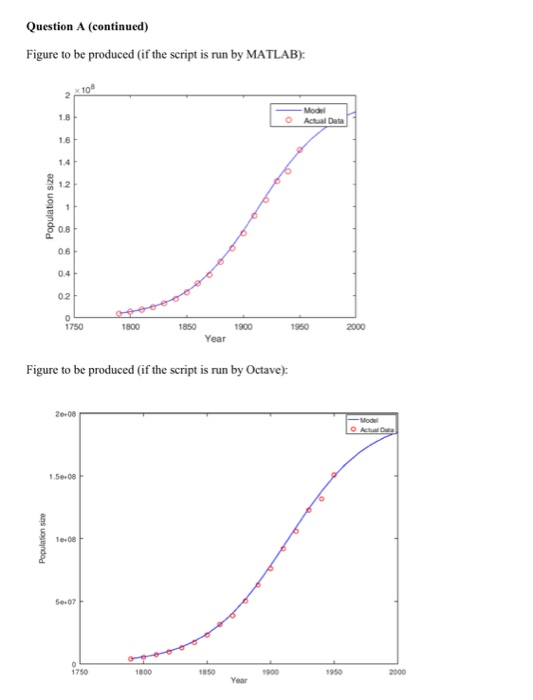 Question A (40%) Write a MATLAB/Octave script that draws a graph of the population of the USA from 1790 to 2000, using the (logistic) model: 197273000 P(1) - where 1 is the date in years. Calculate and plot Pt) (15%) Actual data for every decade from 1790 to 1950 are as follows: Year Population 1790 3 929 000 1800 5 308 000 1810 7 240 000 1820 9 638 000 1830 12 866 000 1840 17 069 000 1850 23 192 000 1860 31 443 000 1870 38 558 000 1880 50 156 000 1890 62 948 000 1900 75 995 000 1910 91 972 000 1920 105 711 000 1930122 775 000 1940131 669 000 1950 150 697 000 Superimpose the above data on the graph of Pt). (10%) Plot the actual data as red colored discrete circles (.e. do not join them with lines) and the model results as blue lines. Make sure that your script produces a figure that looks exactly like the figure on the next page (complete with the axis labels and the legend). (10%) Make sure to write your name and student ID as comments at the beginning of the script file. (5%) Make sure to name the M-file with your student ID number preceded by the letter "A" (e.g. A_10000000.m). (5%) Make sure your script runs without error messages. If any error messages appear after I run your script, you will get NO GRADE from this question. Question A (continued) Figure to be produced (if the script is run by MATLAB): Population size 1750 1800 1850 1900 1950 2000 Year Figure to be produced (if the script is run by Octave): 2.00
Step by Step Solution
There are 3 Steps involved in it
Step: 1

Get Instant Access to Expert-Tailored Solutions
See step-by-step solutions with expert insights and AI powered tools for academic success
Step: 2

Step: 3
Ace Your Homework with AI
Get the answers you need in no time with our AI-driven, step-by-step assistance
Get Started
Databases Theory And Applications 27th Australasian Database Conference Adc 20 Sydney Nsw September 28 29 20 Proceedings Lncs 9877
Authors: Muhammad Aamir Cheema ,Wenjie Zhang ,Lijun Chang
1st Edition
3319469215, 978-3319469218