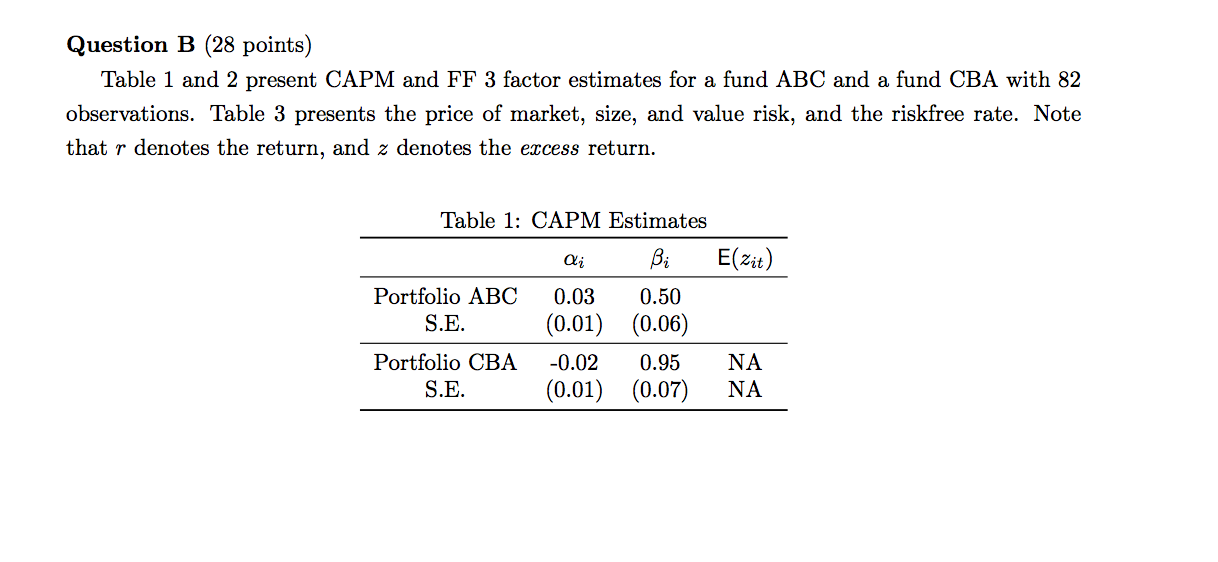
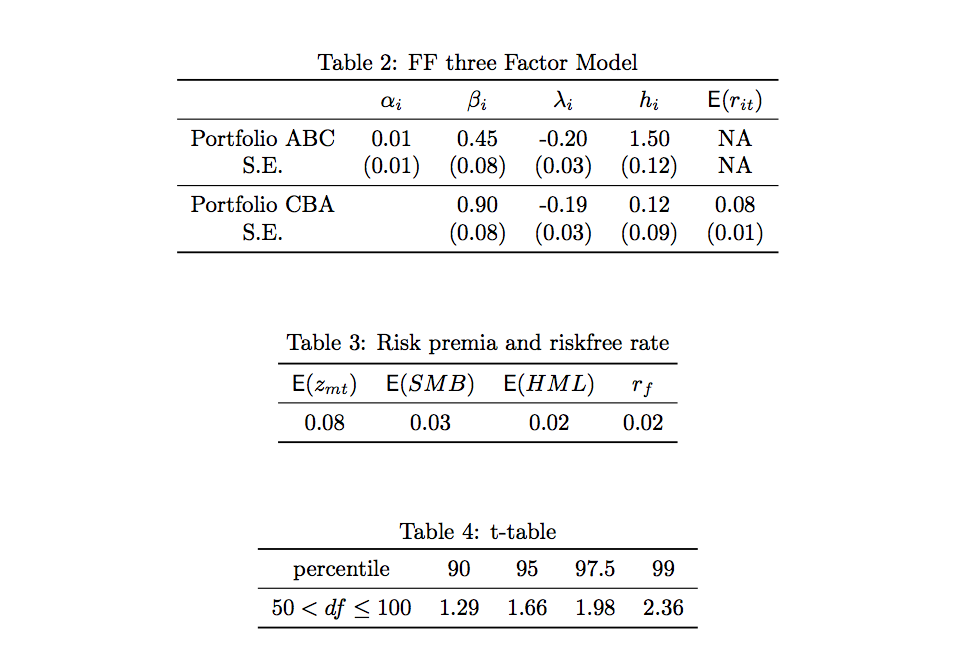
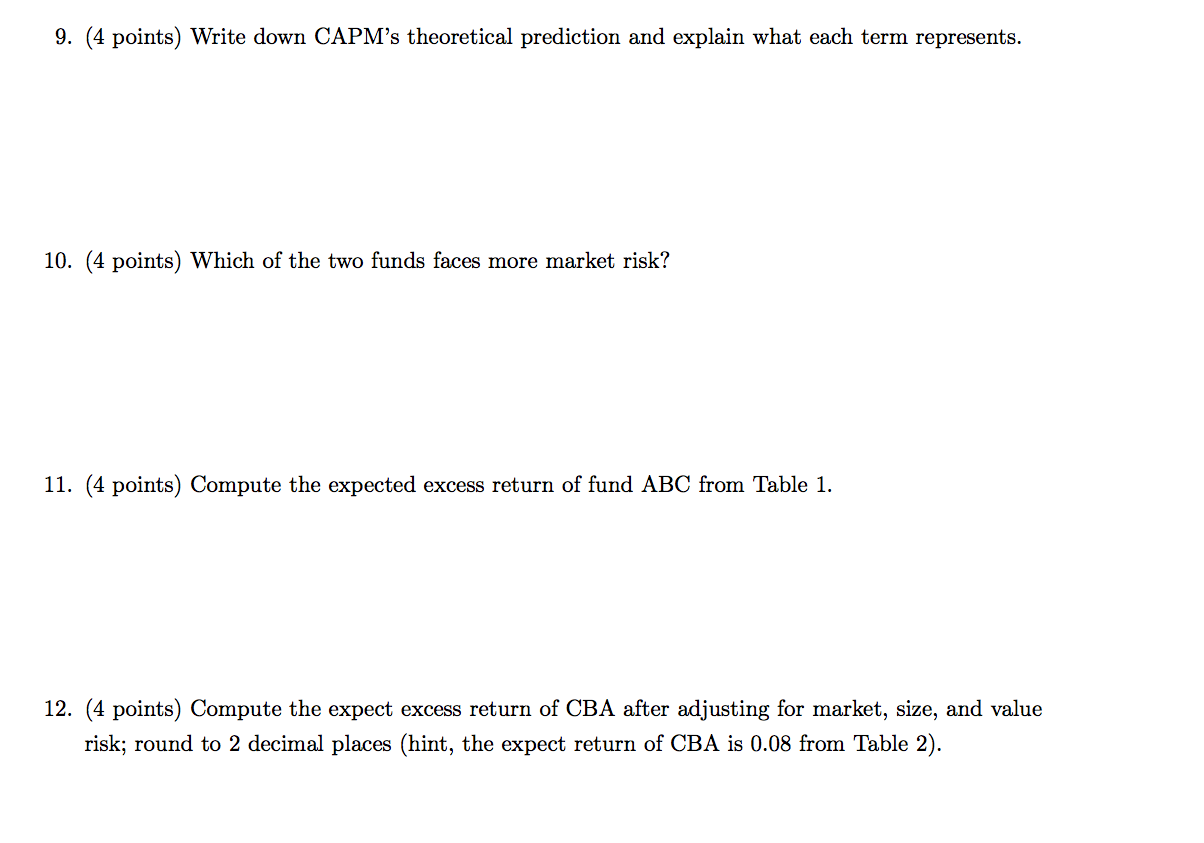
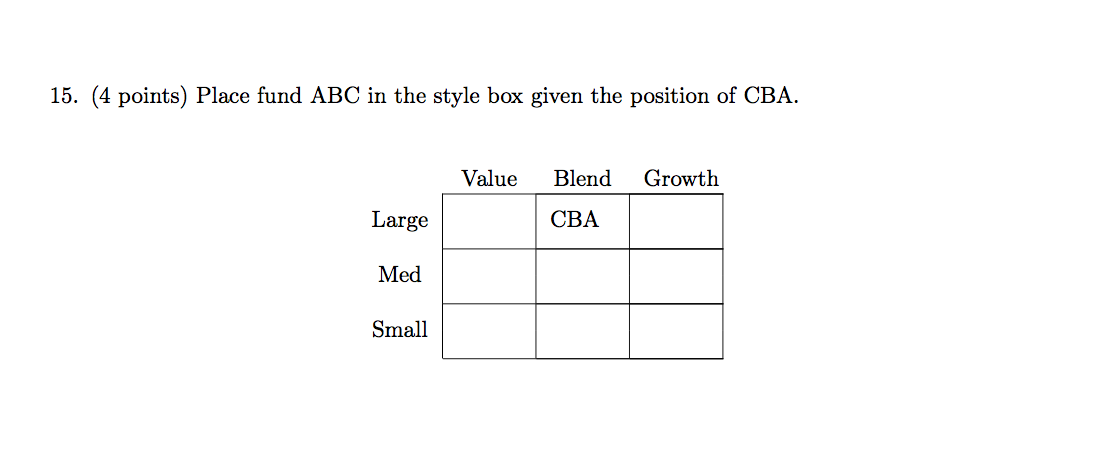
Question B (28 points) Table 1 and 2 present CAPM and FF 3 factor estimates for a fund ABC and a fund CBA with 82 observations. Table 3 presents the price of market, size, and value risk, and the riskfree rate. Note that r denotes the return, and z denotes the excess return Table 1: CAPM Estimates E(zit) Bi Portfolio ABC 0.03 0.50 S.E (0.01) (0.06) Portfolio CBA -0.02 NA 0.95 S.E (0.01) 0.07) NA Table 2 FF three Factor Model (r#) Bi hi Portfolio ABC S.E NA 0.01 0.45 -0.20 1.50 (0.01) (0.08) (0.03) (0.12) NA Portfolio CBA 0.90 -0.19 0.12 0.08 S.E (0.08) (0.03) (0.09) (0.01) Table 3: Risk premia and riskfree rate E(zmt E(SMB) E(HML) 0.08 0.03 0.02 0.02 Table 4: t-table percentile 90 95 97.5 99 50 df 100 1.66 1.29 1.98 2.36 9. (4 points) Write down CAPM's theoretical prediction and explain what each term represents. 10. (4 points) Which of the two funds faces more market risk? 11. (4 points) Compute the expected excess return of fund ABC from Table 1 12. (4 points) Compute the expect excess return of CBA after adjusting for market, size, and value risk; round to 2 decimal places (hint, the expect return of CBA is 0.08 from Table 2) 13. (4 points) Did ABC beat the market portfolio? If yes, use a one-sided test to see if it outper- formed significantly at 5% level (state the null and alternative hypothesis, the test-statistics, the critical value, and whether or not you reject the null; use the attached t-table for the critical value). If not, construct a new portfolio that has the same market risk exposure as ABC but yields higher expect return. Compute the expected return and variance of your constructed portfolio 14. (4 points) Did ABC outperform the FF three factor prediction? If yes, use a one-sided test to 5% level (state the null and alternative hypothesis, the see if it outperformed significantly test-statistics, the critical value, and whether or not you reject the null; use the attached t-table for the critical value) 15. (4 points) Place fund ABC in the style box given the position of CBA Growth Value Blend Large CBA Med Small Question B (28 points) Table 1 and 2 present CAPM and FF 3 factor estimates for a fund ABC and a fund CBA with 82 observations. Table 3 presents the price of market, size, and value risk, and the riskfree rate. Note that r denotes the return, and z denotes the excess return Table 1: CAPM Estimates E(zit) Bi Portfolio ABC 0.03 0.50 S.E (0.01) (0.06) Portfolio CBA -0.02 NA 0.95 S.E (0.01) 0.07) NA Table 2 FF three Factor Model (r#) Bi hi Portfolio ABC S.E NA 0.01 0.45 -0.20 1.50 (0.01) (0.08) (0.03) (0.12) NA Portfolio CBA 0.90 -0.19 0.12 0.08 S.E (0.08) (0.03) (0.09) (0.01) Table 3: Risk premia and riskfree rate E(zmt E(SMB) E(HML) 0.08 0.03 0.02 0.02 Table 4: t-table percentile 90 95 97.5 99 50 df 100 1.66 1.29 1.98 2.36 9. (4 points) Write down CAPM's theoretical prediction and explain what each term represents. 10. (4 points) Which of the two funds faces more market risk? 11. (4 points) Compute the expected excess return of fund ABC from Table 1 12. (4 points) Compute the expect excess return of CBA after adjusting for market, size, and value risk; round to 2 decimal places (hint, the expect return of CBA is 0.08 from Table 2) 13. (4 points) Did ABC beat the market portfolio? If yes, use a one-sided test to see if it outper- formed significantly at 5% level (state the null and alternative hypothesis, the test-statistics, the critical value, and whether or not you reject the null; use the attached t-table for the critical value). If not, construct a new portfolio that has the same market risk exposure as ABC but yields higher expect return. Compute the expected return and variance of your constructed portfolio 14. (4 points) Did ABC outperform the FF three factor prediction? If yes, use a one-sided test to 5% level (state the null and alternative hypothesis, the see if it outperformed significantly test-statistics, the critical value, and whether or not you reject the null; use the attached t-table for the critical value) 15. (4 points) Place fund ABC in the style box given the position of CBA Growth Value Blend Large CBA Med Small