

Question: QUESTION Based on the attached case study CapitaMalls Asia: A Buyout Offer from Capitaland. All information needed to complete the task are in the case
QUESTION
Based on the attached case study CapitaMalls Asia: A Buyout Offer from Capitaland. All information needed to complete the task are in the case study document. Once you have read the document, following are the tasks that you need to complete. 1. Compare performance of CapitaMalls Asia against industry benchmark. 2. Determine the value of CapitalMalls per share using relative/comparison valuation method.
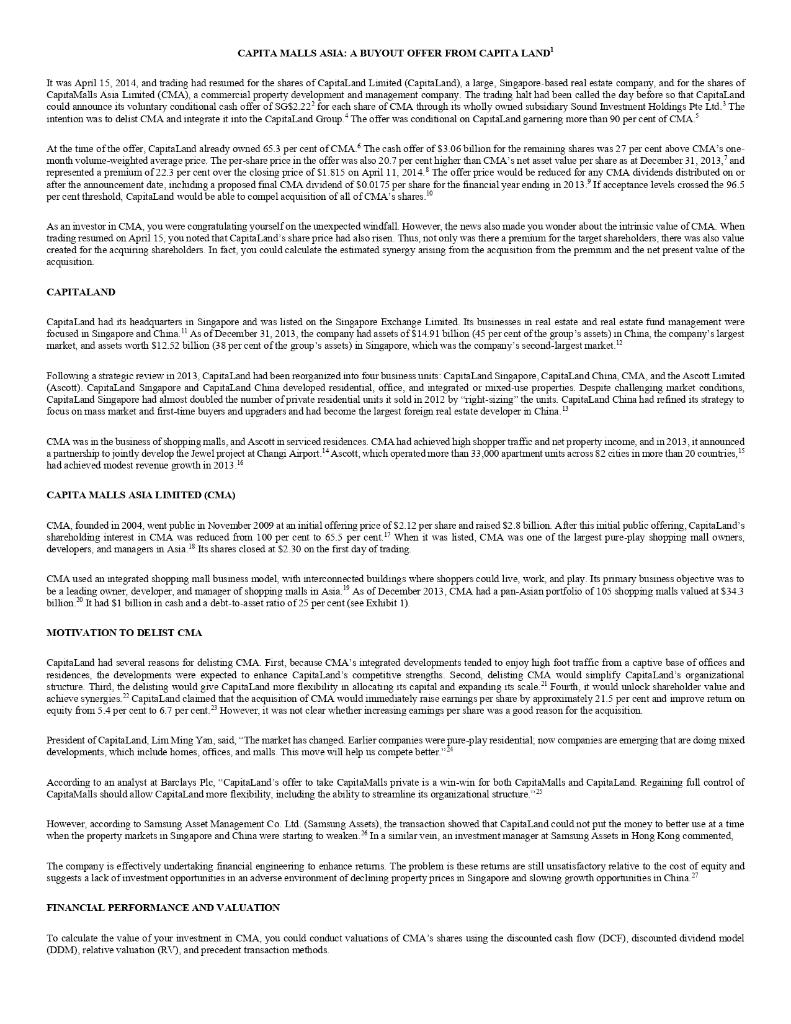
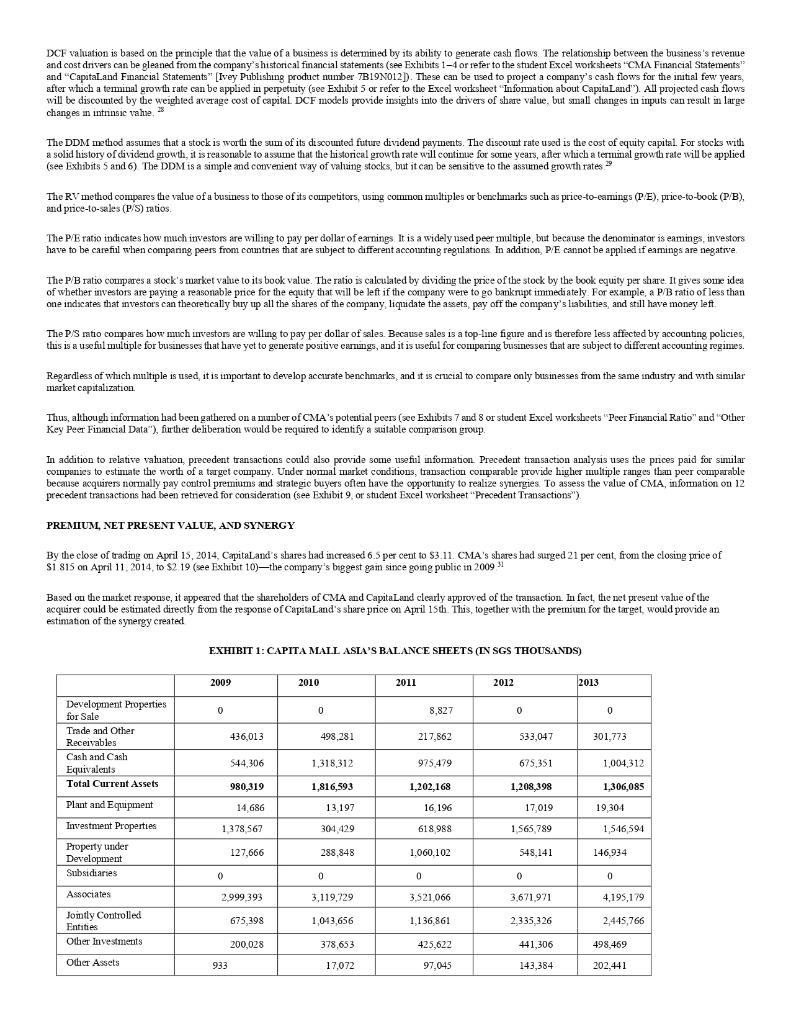
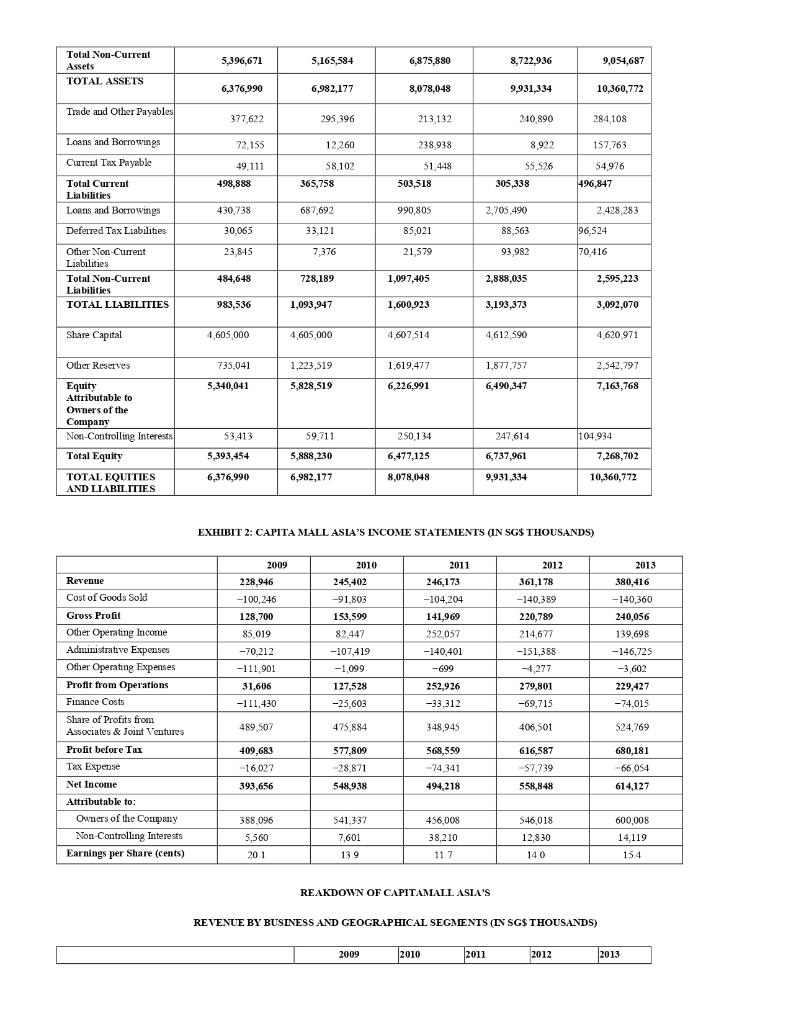
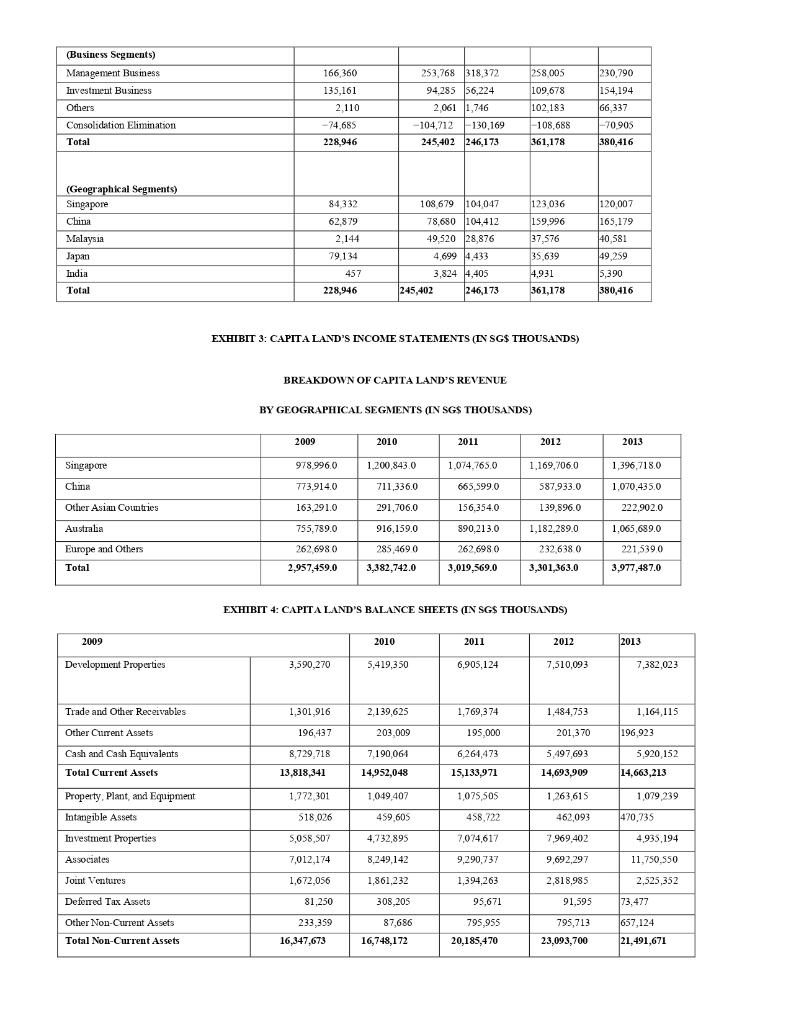
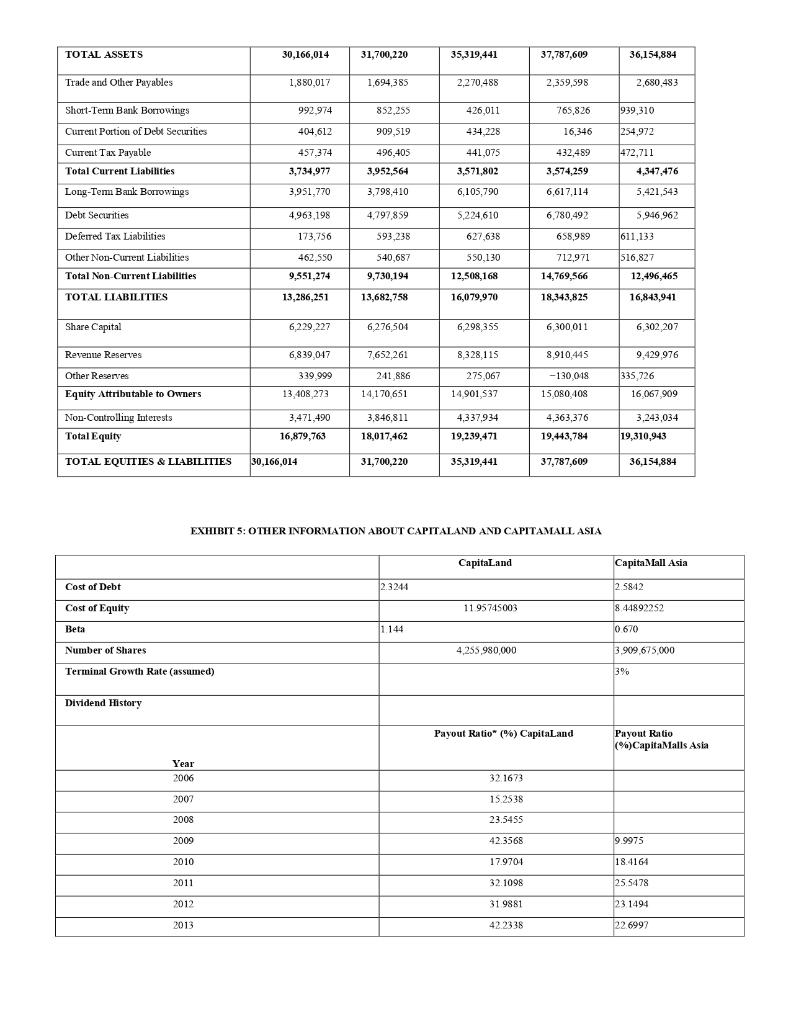
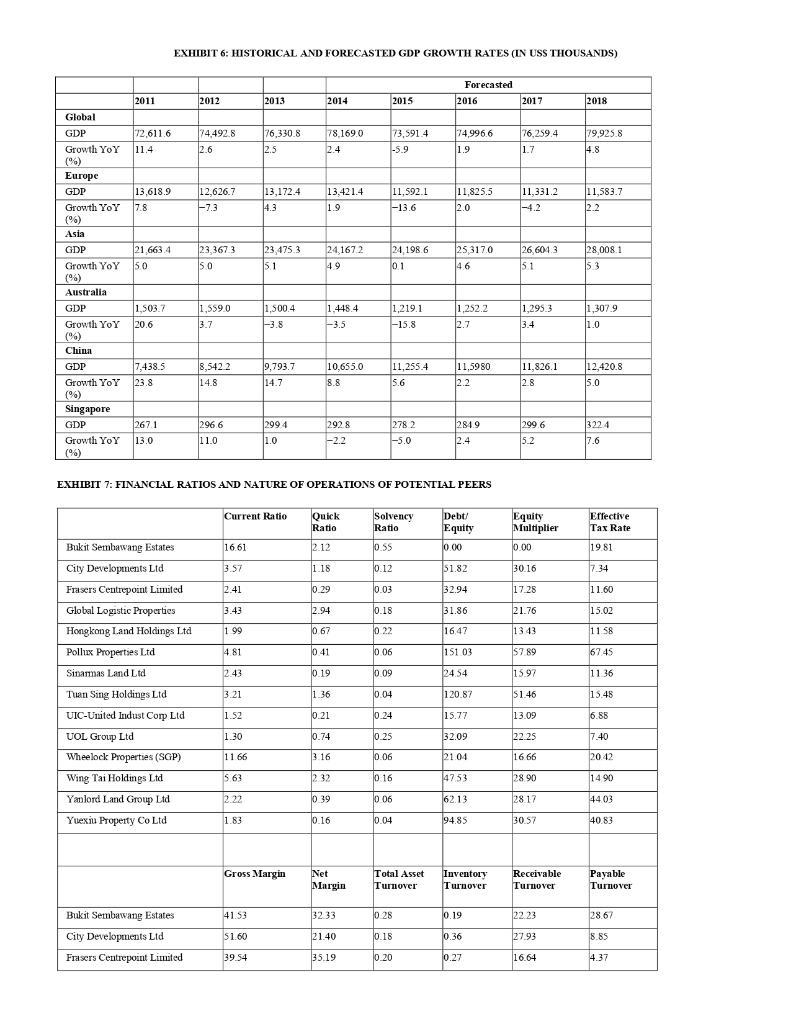
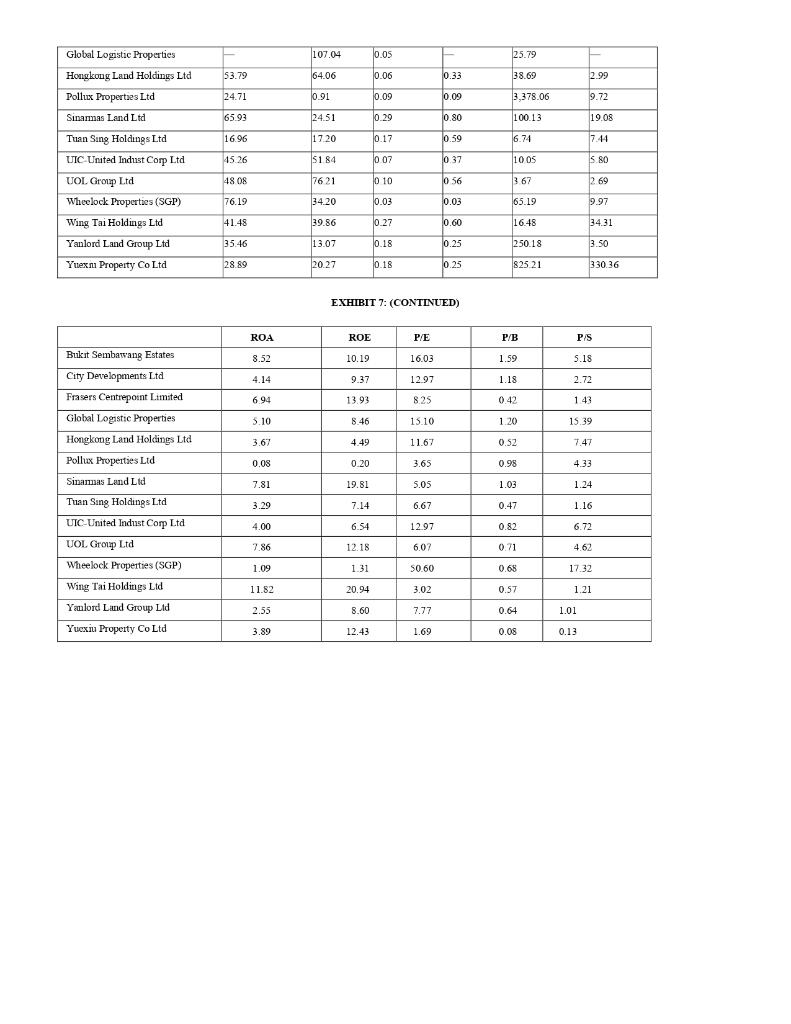
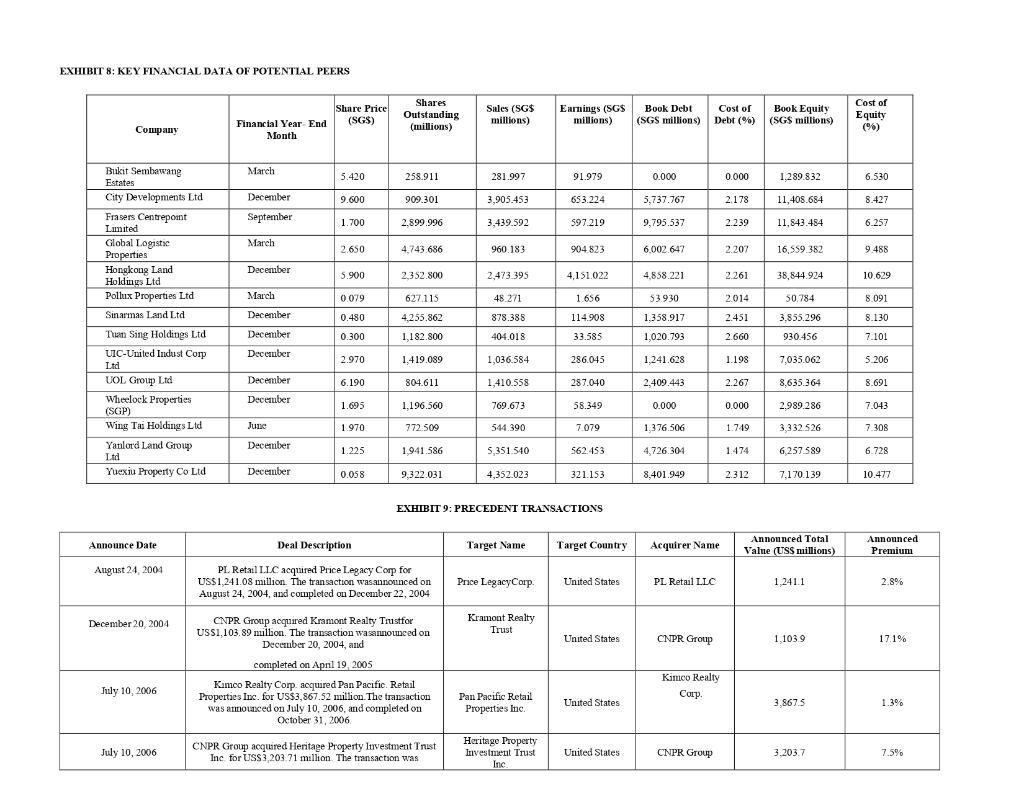
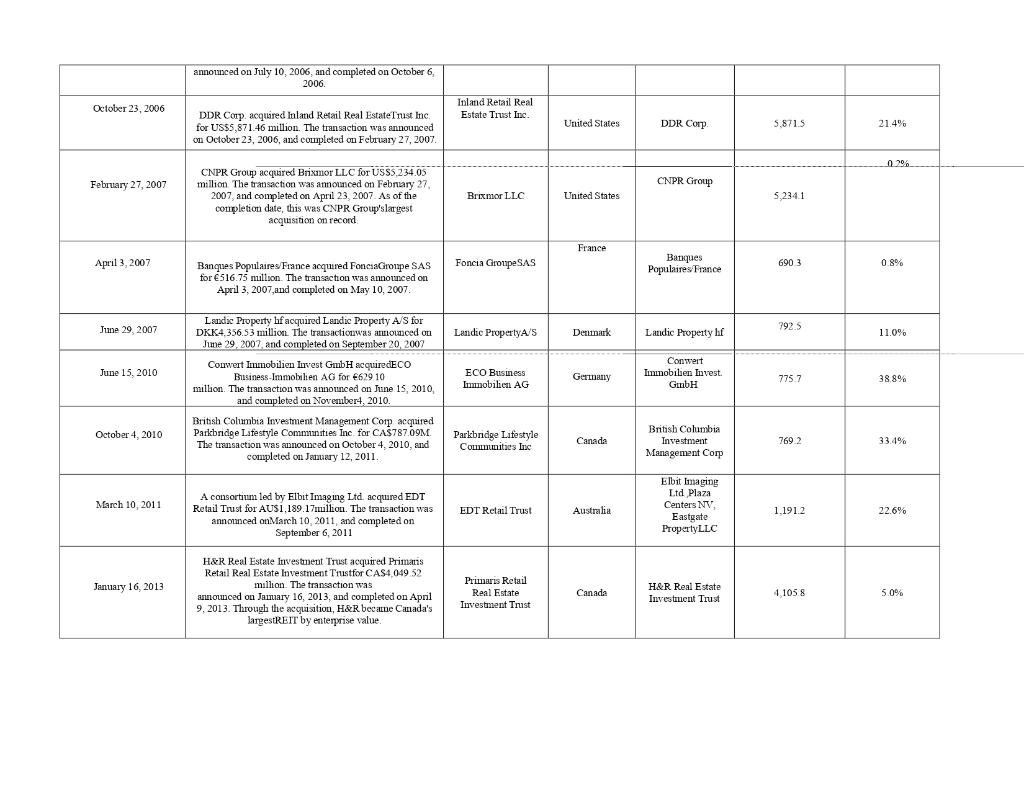
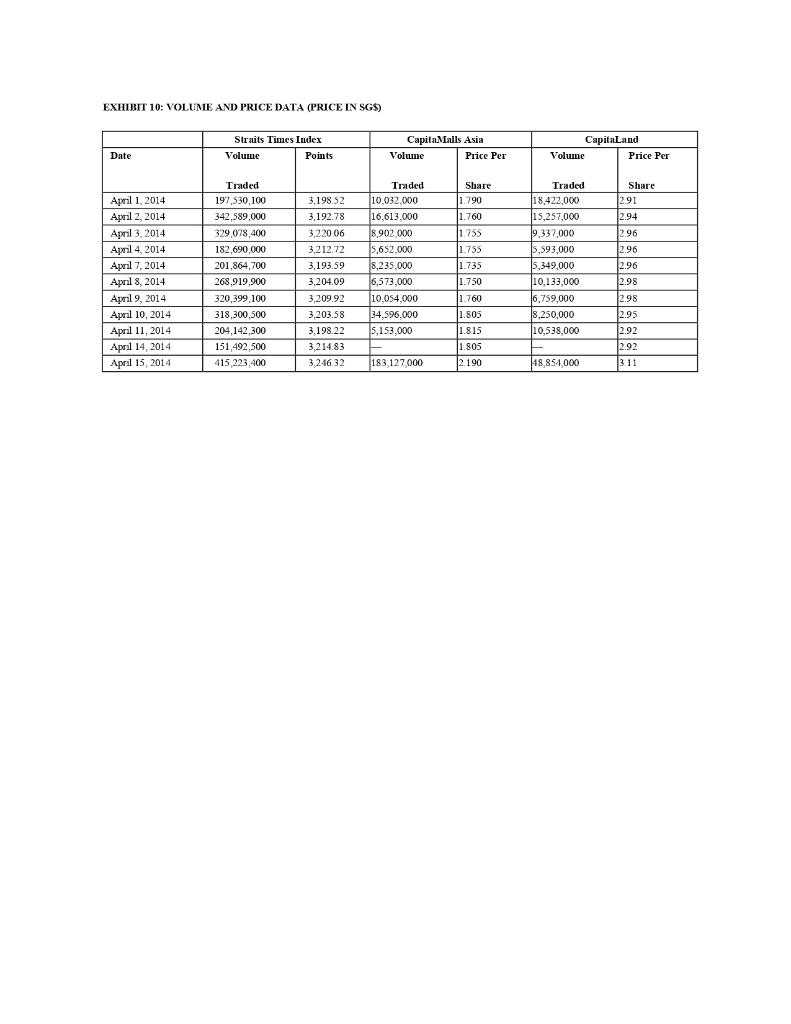
CAPITA MALLS ASIA: A BUYOUT OFFER FROM CAPITA LAND It was April 15, 2014, and trading had resumed for the shares of Capital and Limited (CapitaLand) a large, Singapore-based real estate compatry, and for the shares of CapitaMalls Asia Limited (CMA), a commercial property development and management company. The trading halt had been called the day before so that Capital and could amounce its vohintary conditional cash offer of SG$2.22 for each share of CMA though its wholly owned subsidiary Sound Investment Holdings Pte Ltd. The intention was to delist CMA and integrate it into the Capital and Group The offer was conditional on Capital and garnering more than 90 per cent of CMAS At the time of the offer, CapitaLand already owned 65.3 per cent of CMA The cash offer of S3.06 billion for the remaining shares was 27 per cent above CMA's one- month volume-weighted average price. The per-share price in the offer was also 20.7 per cent higher than CMA's net aset value per share as at December 31, 2013,' and represented a premium of 22.3 per cent over the closing price of $1.515 on April 11, 2014. The offer price would be reduced for any CMA dividends distributed on or after the announcement date, inchiding a proposed final CMA dividend of $0.0175 per share for the financial year ending in 2013. "If acceptance levels crossed the 96.5 per cent threshold, CapitaLand would be able to compel acquisition of all of CMA's shares. As an investor in CMA, you were congratulating yourself on the unexpected windfall. However, the news also made you wonder about the intrinsic value of CMA When trading resumed on April 15, you noted that CapitaLand's share price had also risen Thals, not only was there a premium for the target shareholders, there was also value created for the acquiring shareholders In fact, you could calculate the estimated synergy anising from the acqusition from the premnim and the net present value of the acquisition CAPITALAND CapitaLand had its headquarters in Singapore and was listed on the Singapore Exchange Limited Its businesses in real estate and real estate fund management were focused in Singapore and China." As of December 31, 2013, the company had assets of $14.91 billion (45 per cent of the group's assets) in China, the conipany's largest market, and assets worth $12.52 billion (38 per cent of the group's assets) in Singapore, which was the company's second-largest market.12 Following a strategie review in 2013, Capital and had been reorganized into four business units: CapitaLand Singapore, Capital and China, CMA and the Ascott Limited (Ascott). CapitaLand Singapore and CapitaLand China developed residential, office, and integrated or mixed-use properties. Despate challenging market conditions, CapitaLand Singapore had almost doubled the mumber of private residential units it sold in 2012 by right-sizing the waits. CapitaLand China bad refined its strategy to focus on mass market and first-time buyers and upgraders and had become the largest foreign real estate developer in China." CMA was in the business of shopping malls, and Ascott in serviced residences. CMA had achieved high shopper traffic and net property income, and in 2013, it announced a partnership to jointly develop the Jewel project at Changi Airport. Ascott, which operated more than 33,000 apartment units across 82 cities in more than 20 comties, s had achieved modest revenue growth in 2013. CAPITA MALLS ASIA LIMITED (CMA) CMA, founded in 2004, went public in November 2009 at an initial offering prae of 52.12 per share and raised $2.3 billion. After this initial public offering, CapitaLand's shareholding interest in CMA was reduced frotu 100 per cent to 65.5 per cent. When it was listed, CMA was one of the largest pure-play shopping mall owners, developers, and managers in Asia its shares closed at $2 30 on the first day of trading CMA used an integrated shopping mall busmess model with interconnected buildings where shoppers could live, work, and play. Its primary business objective was to be a leading owner, developer, and manager of shopping malls in Asia." As of December 2013, CMA had a pan-Asian portfolio of 10 shopping malls valued at $343 billion. It had $1 billion in cash and a debt-to-asset ratio of 25 per cent (see Exhibit 1) MOTIVATION TO DELIST CMA CapitaLand bad several reasons for delistmg CMA. First, because CMA's integrated developinents tended to enjoy high foot traffic from a captive base of offices and residences, the developments were expected to enhance Capital.and's competitive strengths Second delisting CMA would simplify Capital and's organizational structure Third, the delisting would gre CapitaLand more flexibility in allocating its capital and expanding its scale." Fouth, it would unlock shareholder vabe and achieve synergies. Capita Land claimed that the acquisition of CMA would immediately raise earnings per share by approximately 21.5 per cent and improve retum on equity from 5.4 per cent to 6.7 per cent. However, it was not clear whether increasing eamings per share was a good reason for the acquisition President of CapitaLand Lim Ming Ya, said, "The market has changed. Earlier companies were pure-play residential, now companies are emerging that are doing mixed developments, which include homes offices and malls This move will help us compete better 33 According to an analyst at Barclays Plc, "CapitaLand's offer to take CapitaMalls private is a win-win for both CapitaMalls and CapitaLand Regaiting full control of CapitaMalls should allow CapitaLand more flexibility, including the ability to streamline its organizational structure *** However, according to Samsung Asset Management Co Ltd (Samsung Assets), the transaction showed that Capital and could not put the money to better use at a time when the property markets in Singapore and China were starting to weaken. In a similar vein, an investment manager at Samsung Assets in Hong Kong commented, The company is effectively undertaking financial engineering to enhance retums. The problem is these retums are still unsatisfactory relative to the cost of equity and suggests a lack of investment opportunities in an adverse environment of declining property prices in Singapore and slowing growth opportunities in China FINANCIAL PERFORMANCE AND VALUATION To calculate the value of your investment m CMA, you could conduct valuations of CMA's shares using the discounted cash flow (DCF), discounted dividend model (DDM), relative valization (RV), and precedent transaction methods DCF valuation is based on the principle that the value of a business is determined by its ability to generate cash flows. The relationship between the business's revenue and cost drivers can be gleaned from the company's historical financial statements (see Exhibits 1-4 or refer to the student Excel worksheets CMA Financial Statements." and "CapitaLand Financial Statements" [Ivey Publishing product number 7B19N012). These can be used to project a company's cash flows for the initial few years, after wluch a tenminal growth rate can be applied in perpetuity (see Exhibit 5 or refer to the Excel worksheet "Information about CapitaLand'). All projected cash flows will be discounted by the weighted average cost of capital. DCF models provide insights into the drivers of share value, but small changes in inputs can result large changes in intrinsie vahe. 23 The DDM method assumes that a stock is worth the sum of its discounted future dividend payments. The discount rate used is the cost of equity capital. For stocks with a solid history of dividend growth, it is reasonable to assume that the historical growth rate will contime for some years, after which a termal growth rate will be applied (see Exhibits 5 and 6) The DDM is a simple and convenient way of vahing stocks, but it can be sensitive to the assumed growth rates 29 The RV method compares the value of a business to those of its competitors, usmg common multiples or benchmarks such as price-to-eamings (PE), price-to-book (PB), and price-to-sales (P/S) ratios. The PE ratio indicates how much investors are willing to pay per dollar of earrings it is a widely used peer multiple, but because the denominator is eamings, investors have to be carefiil when comparing peers from countries that are subject to different accounting regulations. In addition, PE cannot be applied if eamings are negative The P/B ratio compares a stock's market value to its book value. The ratio is calculated by dividing the price of the stock by the book equity per share. It gives some idea of whether investors are paying a reasonable price for the equity that will be left if the company were to go batiknapt immediately. For example, a P/B ratio of less than one indicates that investors can theoretically buy up all the shares of the company, liquidate the assets pay off the company's liabilities, and stall have money left The PS ratio compares how much investors are willing to pay per dollar of sales. Because sales is a top-line figure and is therefore less affected by accounting policies, tlus is a useful multiple for businesses that have yet to generate positive earnings, and it is useful for comparing businesses that are subject to different accounting regimes. Regardless of which multiple is used it is important to develop accurate benchmarks, and it is crucial to compare only businesses from the same industry and with similar market capitalization Thus, although information had been gathered on a manber of CMA's potential peers (sce Exhibits 7 and 8 or student Excel worksheets "Peer Financial Ratio" and Other Key Peer Financial Data"), further deliberation would be required to identify a suitable comparison group In addition to relative valuation, precedent transactions could also provide some useful information Precedent transaction analysis uses the pnces paid for similar companies to estunate the worth of a target company. Under nomal market conditions, transaction comparable provide higher multiple ranges than peer comparable because acquirers normally pay control premiums and strategic buyers often have the opportunity to realize synergies To assess the value of CMA, information on 12 precedent transactions had been retrieved for consideration (see Exhibit 9 or student Excel worksheet"Precedent Transactions"). PREMIUM, NET PRESENT VALUE, AND SYNERGY By the close of trading on April 15, 2014, Cerita Land's shares had increased 6.5 per cent to $3.11. CMA's shares had surged 21 per cent, from the closing price of Si 815 on April 11, 2014 to $2 19 (see Exhibit 10)the company's biggest gam since going public in 2009 Based on the market response, it appeared that the shareholders of CMA and CapitaLand clearly approved of the transaction. In fact, the net present value of the acquirer could be estimated directly from the response of CapitaLand's share price on April 15th. This, together with the premiumn for the target would provide an estimation of the synergy created EXHIBIT 1: CAPITA MALL ASLA'S BALANCE SHEETS (IN SGS THOUSANDS) 2009 2010 2011 2012 2013 Development Properties 0 0 8,827 0 0 for Sale 436,013 498,281 217,862 533,047 301,773 Trade and Other Receivables Cash and Cash Equivalents $44.306 1,318,312 975,479 675,351 1,004,312 Total Current Assets 980,319 1,816,593 1,202,168 1,208,398 1,306,085 14.686 13197 16 196 17,019 19,304 Plant and Equpment Investment Properties 1,378,567 304,429 618.988 1.565,789 1,546,594 127,666 288,848 1.060.102 548,141 146,934 Property under Development Subsidiaries 0 0 0 0 0 Associates 2999 393 3,119,729 3,521,066 3,671.971 4,195,179 Jomtly Controlled Entities 675,398 1,043 656 1,136,861 2,335,326 2,445,766 Other Investments 200,028 378,653 425,622 441,306 498,469 Other Assets 933 17,072 97,045 143,384 202.441 Total Non-Current Assets 5,396,671 5,165,584 6,875,880 8,722,936 9,054,687 TOTAL ASSETS 6,376,990 6,982,177 8,078,048 9,931,334 10,360,772 Trade and Other Payables 377622 295 396 213 132 240.890 284108 Loans and Borrowings 72.155 12 260 238.938 8.922 157.763 Current Tax Payable 49, 111 58,102 51,448 SS.526 54.976 498,888 365,758 503,518 305,338 496,847 Total Current Liabilities Loans and Borrowings 430,738 687,692 990,805 2,705,490 2.428.283 Deferred Tax Liabilities 30,065 33,121 85,021 88,563 96,524 23,845 7,376 21 579 93,982 70,416 Other Non Current Liabilities Total Non-Current Liabilities 484,648 728,189 1,097,405 2,888.035 2.595,223 TOTAL LIABILITIES 983,536 1,093,947 1.600,923 3,193,373 3,092,070 Share Capital 605.000 4.605 000 4,605 000 4 607 514 4.612 590 4 620 971 Other Reserves 735,041 1,223,519 1,619,477 1,877,757 2.542.797 5,340,041 5,828,519 6,226,991 6,490,347 7,163,768 Equity Attributable to Owners of the Company Non-Controlling Interests Total Equity $3,413 59.711 250 134 247,614 104 934 5,393,454 5,888,230 6,477,125 6,737,961 7,268,702 6,376,990 6,982,177 8,078,048 9,931,334 10,360,772 TOTAL EQUITIES AND LIABILITIES EXHIBIT 2: CAPITA MALL ASIA'S INCOME STATEMENTS (IN SG$ THOUSANDS) 2009 2010 2011 2012 2013 Revenue 228,946 245,402 246.173 361,178 380,416 Cost of Goods Sold -100.246 -91,803 -104,204 -140,389 -140,360 Gross Profit 128.700 153,599 141.969 220,789 240,056 Other Operating Income 85019 82.447 252057 214,677 139 698 Administrative Expenses -70.21 -107,419 -140,401 -151,388 -146,725 -111,901 -1,099 -699 -4,277 -3.602 31,606 127,528 252,926 279,801 229,427 -111,430 -25,603 -33.312 -69,715 -74,015 Other Operating Expenses Profit from Operations Finance Costs Share of Profits from Associates & Joint Ventures Profit before Tax 489 507 475.884 348,945 406,501 $24.769 409,683 577,809 568,559 616,587 680,181 Tax Expense -16.027 -28,871 -74341 -57,739 66 054 Net Income 393,656 548,938 494,218 558,848 614,127 Attributable to: Owners of the Company 368,096 41,337 456,008 S46,018 600,008 5,560 7,601 38,210 12,830 14,119 Non-Controlling Interests Earnings per Share (cents) 201 13 9 11.7 140 154 REAKDOWN OF CAPITAMALL ASIA'S REVENUE BY BUSINESS AND GEOGRAPHICAL SEGMENTS (IN SG$ THOUSANDS) 2009 2010 2011 2012 2013 (Business Segments) Management Business 166,360 Investment Business 135,161 258 005 109.678 102.183 230,790 154,194 166 337 Others 253,768 318,372 94.285 56,224 2.061 1.746 -104,212 -130.169 245,402 2-46,173 2.110 Consolidation Elimination -74,685 -108,688 361,178 |-70905 380,416 Total 228,946 (Geographical Segments) Singapore 84332 120 007 108 679 104,047 78.650 104,412 China 62,879 165,179 2.144 40 581 Malaysia Japan 123036 159,996 37,576 35 639 4,931 361,178 79.134 49.520 28,876 4.699 4,433 3,824 4,405 245,402 246,173 49,259 India 457 5,390 Total 228,946 380,416 EXHIBIT 3: CAPITA LAND'S INCOME STATEMENTS (IN SG$ THOUSANDS) BREAKDOWN OF CAPITA LAND'S REVENUE BY GEOGRAPHICAL SEGMENTS (IN SG$ THOUSANDS) 2009 2010 2011 2012 2013 Singapore 978.9960 1,200,843.0 1,074,765.0 1.169,706.0 1,396,718,0 Chia 773.914.0 711,336.0 665,599.0 587,933.0 1.070,435.0 Other Asian Countries 163,291.0 291,706.0 156,354.0 139,896.0 222,902.0 Australia 755.789.0 916.159.0 890.213.0 1,182.289.0 1,065,689.0 Europe and Others 262 698 0 285,469 0 262 698 0 232 638 0 221 5390 Total 2,957,459.0 3,382,742.0 3,019,569.0 3,301,363.0 3,977,487.0 EXHIBIT 4: CAPITA LAND'S BALANCE SHEETS (IN SG$ THOUSANDS) 2009 2010 2011 2012 2013 Developiticul Properties 3,590,270 5,419,350 6,905,124 7,510.093 7,382,023 Trade and Other Receivables 1,301,916 2.139,625 1,769,374 1,484,753 1,164,115 196,437 203,009 195,000 201,370 196,923 Other Current Assets Cash and Cash Equuvalents 8,729,718 7.190 064 6264473 5,497,693 5.920 152 Total Current Assets 13,818,341 14,952,048 15,133.971 14.693,909 14,663,213 Property, Plant, and Equipment 1,772 301 1.049,407 1,075,SOS 1,263,615 1079,239 Intangible Assets 518 026 459.605 458.222 462,093 470,735 Investment Properties 5,058 507 4,732,895 7,074,617 7.969,402 4,935,194 Associates 7,012,174 8.249.142 9,290,737 9,692,297 11,750.550 Joint Ventures 1,672,056 1.861,232 1,394,263 2.818,985 2,525,352 Deferred Tax Assets 81,250 308,205 95,671 91,595 73.477 Other Non-Current Assets 233,359 87,686 795.955 795,713 657,124 - - Total Non-Current Assets 16,347.673 16,748,172 20,185,470 23,093,700 21,491,671 TOTAL ASSETS 30,166,014 31,700,220 35,319,441 37,787,609 36,154,884 Trade and Other Payables 1,880,017 1,694,385 2,270,488 2,359,598 2,680 483 Short-Temn Bank Borrowings 992 974 852,255 426,011 765,826 1939,310 404,612 909,519 434,228 16,346 254,972 Current Portion of Debt Securities Current Tax Payable 457.374 496,405 441,075 432,489 472,711 Total Current Liabilities 3,734,977 3,952,564 3,571,802 3,574,259 4,347,476 Long-Tem Bank Borrowings 3,951,770 3,798,410 6,105,790 6,617,114 5,421,543 Debt Securities 4,963,198 4,797,859 5,224,610 6,780,492 5.946 962 Deferred Tax Liabilities 173,756 593,238 627,638 656,989 1611,133 Other Non-Current Liabilities 462,550 540,687 550,130 712,971 516,827 Total Non-Current Liabilities 9,551,274 9,730,194 12,508,168 14,769,566 12,496,465 TOTAL LIABILITIES 13,286,251 13,682,758 16,079.970 18,343,825 16,843,941 Share Capital 6,229 227 6,276,504 6,298 355 6 300 011 6 302 207 Revenue Reserves 6,839 047 7.652 261 8,328.115 8,910,445 9,429 976 Other Reserves 339 999 241 886 275,067 -130,018 335 726 Equity Attributable to Owners 13,408,273 14170651 14,901,537 15 080 408 16.067 909 Non-Controlling Interests 3,471,490 3,846,811 4,337,934 4,363,376 3.243,034 Total Equity 16,879,763 18,017,462 19,239,471 19,443,784 19,310,943 TOTAL EQUITIES & LIABILITIES 30,166,014 31,700,220 35,319,441 37,787,609 36,154,884 EXHIBIT 5: OTHER INFORMATION ABOUT CAPITALAND AND CAPITAMALL ASIA CapitaLand CapitaMall Asia Cost of Debt 2.3244 2 5842 Cost of Equity 11 95745003 8 44892252 Beta 1.144 0670 Number of Shares 4,255,980,000 3.909 675.00 Terminal Growth Rate (assumed) 3% Dividend History Payout Ratio" (%) CapitaLand Payout Ratio (%)CapitaMalls Asia Year 2006 32 1673 2002 15.2538 2008 23.5455 2009 42.3568 9.9975 2010 17.9704 18.4164 2011 32.1098 25.5478 2012 31 9881 23 1494 2013 42.2338 22 6992 EXHIBIT 6: HISTORICAL AND FORECASTED GDP GROWTH RATES (IN USS THOUSANDS) Forecasted 2011 2012 2013 2014 2015 2016 2017 2018 Global GDP 72,6116 76.330 8 78,1690 73.591.4 74,996.6 76,259.4 79,925.8 174,492.8 2.6 11.4 2.5 2.4 -5.9 1.9 1.7 14.8 Growth YoY (9) Europe GDP 13,618.9 13.421.4 11,825.5 12,626. -7.3 13,172.4 4.3 11,5921 -13.6 11,331.2 -4.2 11,583.7 2.2 7.8 1.9 2.0 Growth YoY (9) Asia GDP 24 1672 21.663.4 SO 23,3673 SO 23,4753 51 24 1986 01 25 3170 4.6 26,6043 5.1 28 0081 53 4.9 Growth YoY (%) Australia GDP 1.503.7 1,500.4 1.448.4 11.219.1 1,252.2 1,295.3 11,5590 3.7 1,3079 10 20.6 |-3.8 -3.5 -15.8 2.7 3.7 Growth YoY (%) China GDP 10.6550 11,826.1 7.438.5 23.8 8,5422 14.8 9,793.7 14.7 11,255 4 5.6 11,5980 2.2 12,420.8 5.0 8.8 2.8 Growth YoY (%) Singapore GDP 2671 2928 3224 2966 11.0 299 4 1.0 2782 -5.0 284.9 2.4 299 6 5.2 13.0 -2.2 7.6 Growth YoY (%) EXHIBIT 7: FINANCIAL RATIOS AND NATURE OF OPERATIONS OF POTENTIAL PEERS Current Ratio Quick Ratio Solvency Ratio Debt! Equity Equity Multiplier 0.00 Effective Tax Rate Bukit Sembawang Estates 16.61 2.12 0.55 0.00 1981 City Developments Ltd 3.57 1.18 0.12 51.82 30.16 7.34 Frasers Centrepoint Litted 2.41 0.29 10.03 32.94 17.28 11.60 3.43 2.94 0.18 31.86 21.76 15.02 Global Logistic Properties Hongkong Land Holdings Ltd 1.99 067 0.22 1647 1343 1158 Pollux Properties Ltd 4.81 0.41 0 06 151 03 $789 67 45 Sinamas Land Ltd 2.43 0.19 0 09 24.54 15.97 11 36 Tuan Sing Holdings Ltd 3.21 1.36 10.04 120.87 51.46 15.48 UIC-United Indust Corp Ltd 1.52 0.21 0.24 15.77 13.09 6.85 UOL Group Ltd 1.30 10.74 0.25 32.09 22.25 7.40 Wheelock Properties (SGP) 11 66 3.16 0.06 21.04 16.66 20.42 Wing Tai Holdings Ltd 5 63 2.32 0 16 14753 28.90 1490 Yanlord Land Group Ltd 2.22 0.39 0 06 62.13 28.17 4403 Yuexiu Property Co Ltd 1.83 0.16 0.04 94.85 30.57 40.83 Gross Margin Net Margin Total Asset Turnover Inventory Turnover Receivable Turnovet Payable Turnove 41.53 32 33 0.28 0.19 22.23 28.67 Bukit Sembawang Estates City Developments Ltd $1.60 21.40 0.18 0.36 27.93 8.85 Frasers Centrepoint Limited 39.54 35.19 10.20 0.27 16.64 4.37 Global Logistic Properties 107.04 0.05 25.79 53.79 64.06 10.06 0.33 38.69 2.99 Hongkong Land Holdings Ltd Pollux Properties Ltd 24.71 0.91 0.09 0.09 3,378.06 9.72 Sinannas Land Ltd 65.93 24.51 10.29 0.80 100.13 19.08 Tuan Sung Holdings Ltd 16.96 17.20 0.17 0.59 6.74 17.44 UIC United Indust Corp Ltd 45.26 $184 007 037 10 OS S.80 UOL Group Ltd 48 08 7621 lo 10 0 56 2 69 Wheelock Properties (SGP) 76.19 34.20 0.03 0.03 65.19 9.97 Wing Tai Holdings Ltd 41.48 39.86 0.27 0.60 16.48 34.31 35.46 13.07 0.18 0.25 250.18 3.50 Yanlord Land Group Ltd Yuexni Property Co Ltd 28.89 20.27 0.18 0.25 825 21 330.36 EXHIBIT 7: (CONTINUED) ROA ROE P/E P/B P/S Bukit Sembawang Estates 8.52 10.19 16.03 1.59 5.18 City Developments Ltd 9.37 12.97 1.18 2.72 Frasers Centrepoint Limited 6.94 13.93 825 0.42 1.43 Global Logistic Properties 3.10 8.46 15.10 1.20 15.39 Hongkong Land Holdings Ltd 3.67 4.49 11.67 0.52 7.47 Pollux Properties Ltd 0.08 0.20 3.65 0.98 4.33 Sinamas Lund Lid 7.81 19.81 5.05 1.03 1.24 3.29 7.14 6.67 0.47 1.16 4.00 6.54 12.97 0.82 6.72 7.86 12.18 607 0.71 4.62 Tuan Sing Holdings Ltd UTC United Indust Corp Ltd UOL Group Ltd Wheelock Properties (SGP) Wing Tai Holdings Ltd Yamlord Land Group Ltd 1.09 1.31 50.60 0.65 17.32 11.82 20.94 3.02 0.57 1.21 2.55 8.60 7.77 0.64 1.01 Yuexiu Property Co Ltd 3.89 12.43 1.69 0.08 0.13 EXHIBIT 8: KEY FINANCIAL DATA OF POTENTIAL PEERS Book Debt Cost of Shure Price (SGS) Shares Outstanding (millions) Sales (SG$ millions) Earnings (SGS millions) Book Equity (SGS millions) Debt (%) (SG$ millions) Cost of Equity (%) Financial Year End Company Month March 5.420 258.911 281.997 91.979 0.000 0.000 1,289.832 6.530 Bukit Sembawang Estates City Developments Ltd December 9.600 909.301 3,905.453 653.214 5,737.767 2178 11,408.684 8.427 September 1.700 2,899.996 3,439.592 597.219 9.795.537 2.239 11,843.484 6.257 March 2.650 4,743.686 960.183 904823 6.002.647 2.207 16,559 382 9.488 Frasers Centrepoint Limited Global Logiste Properties Hongkong Land Holdings Ltd Pollux Properties Ltd December 5.900 2.352.800 2,473.395 4,151.022 4,858.221 2.261 38.844.924 10.629 March 0.079 627.115 45.271 1.656 53930 2014 50.784 8.091 Sinarmas Land Ltd December 0.480 4.255.862 878.388 114.908 1,358.917 2.451 3.855.296 8.130 Thuan Sing Holdings Ltd December 0.300 1,182.800 404.018 33.585 1,020.793 2.660 930.456 7.101 December 2.970 1.419.089 1,036.584 286.045 1.241 628 1.198 7,035.062 5.206 December 6.190 804.611 1,410.558 287.040 2,409.443 2.267 8.635,364 8.691 December 1.695 1.196.560 769.673 58.349 0.000 0.000 2.989.286 7.043 UIC-United Indust Corp Ltd UOL Group Ltd Wheelock Properties (SGP) Wing Tai Holdings Ltd Yatilord Land Group Ltd Yuexiu Property Co Ltd June 1.970 772 509 544.390 7.079 1,376,506 1.749 3,332 526 7.308 December 1.225 1.941.586 5,351.540 562 453 4,726,304 1.474 6,257 589 6.728 December 0.058 9.322.031 4,352.023 321.153 8,401.949 2.312 7.170.139 10.477 EXHIBIT 9: PRECEDENT TRANSACTIONS Announce Date Deal Description Target Name Target Country Acquirer Name Announced Total Value (USS millions) Announced Premium August 24 2004 PL. Retail LLC acquired Price Legacy Corp for USS 1,241.08 million. The transaction was announced on August 24, 2004, and completed on December 22, 2004 Price Legacy Corp United States PL Retail LLC PL Retail LLC 1,241.1 2.8% December 20, 2004 Kramont Realty Trust United States CNPR Group 1.1039 17.1% CNPR Group acquired Kramont Realty Trustfor US$1,103,89 million. The transaction wasannomced on December 20, 2004, and completed on Apnl 19 2005 Kamco Realty Corp. acquired Pan Pacific Retail Properties Inc. for US$3,867.52 million. The transaction was announced on July 10, 2006, and completed on October 31, 2006 Kimco Realty July 10, 2006 . Pan Pacific Retail Properties Inc United States 3,867.5 1.3% July 10, 2006 CNPR Group acquired Heritage Property Itvestment Trust Inc for USS3,203 71 million. The transaction was Heritage Property Investment Trust Inc United States CNPR Group 3.203.7 7.5% announced on July 10, 2006, and completed on October 6, 2006. October 23, 2006 Inland Retail Real Estate Trust Inc. United States DDR Corp. acquired Inland Retail Real Estate Trust Inc. for US$5,871.46 million. The transaction was announced on October 23, 2006, and completed on February 27, 2007 DDR Corp 5.871.5 21.4% February 27, 2007 CNPR Group CNPR Group acquired Brixmor LLC for US$5,234.05 million The transaction was announced on February 27, 2007, and completed on April 23, 2007. As of the completion date, this was CNPR Group's largest acquisition on record Bremor LLC United States Brixmor LLC United States 5.2341 France France Banques April 3, 2007 Foncia Groupe SAS 6903 0.8% Banques Populaires France acquired FonciaCroupe SAS for 516.75 nullion. The transaction was announced on April 3, 2007, and completed on May 10, 2007. Populaires France Landic Property hf acquired Landic Property A/S for 7925 June 29, 2007 DKK4.356.53 million. The transactiouwas announced on Landie PropertyA/S Detumark Landic Property hf 11.0% Time 29, 2007, and completed on September 20, 2007 Conwert June 15, 2010 ECO Business Immobilien AG Germany Conwert Immobilien Invest GmbH acquiredECO Business-Immobilen AG for 629 10 million. The transaction was announced on June 15, 2010, and completed on November4, 2010. Innobilien Invest. GmbH 775 7 38.8% October 4, 2010 British Columbia Investment Management Corp acquired Parkbridge Lifestyle Communities Inc for CAS787.09M. The transaction was announced on October 4, 2010, and completed on January 12, 2011. Parkbridge Lifestyle Communities Inc Canada British Columbia Investment Management Corp 7692 33.4% March 10, 2011 EDT Retail Trus EDT Retail Trust Australia Elbit Imaging Ltd Plaza Centers NV Eastgate Property LLC A consortium led by Elbit Imaging Ltd acquired EDT Retail Trust for AUS1.189.17million. The transaction was announced on March 10, 2011, and completed on September 6, 2011 Australia 1.191.2 22.6% Primaris Retail January 16, 2013 H&R Real Estate Investment Trust acquired Primaris Retail Real Estate Investment Trust for CAS4 049 52 million. The transaction was announced on January 16, 2013, and completed on April 9, 2013. Through the acquisition, H&R became Canada's largestREIT by enterprise value Real Estate Canada H&R Real Estate Investment Trust 4.1058 5.0% Investment Trust EXHIBIT 10: VOLUME AND PRICE DATA (PRICE IN SGS) Straits Times Index Capital Malls Asia Capita Land Date Volume Points Volume Price Per Volume Price Per Traded Traded Share Traded 197,530,100 3,198.52 1.790 April 1, 2014 April 2, 2014 April 3, 2014 Share 2.91 2.94 342.589,000 3,192.78 1.760 329,078,400 April 4, 2014 10,032.000 16,613,000 8,902.000 5,652.000 5,235,000 6,573,000 3,220 06 3.212.72 3,193.59 182,690,000 14.96 2.96 1.755 755 11.755 1.735 725 1.750 750 201,864,700 18,422,000 15,257,000 9,337,000 5,593,000 5,349,000 10,133,000 6,759,000 8,250,000 10,538,000 2.96 268.919 3,204.09 2.98 320,399.100 3,209.92 10,054.000 April 7, 2014 April 8, 2014 2014 . April 9, 2014 April 10, 2014 April 11, 2014 April 14, 2014 April 15, 2014 1.760 318,300,500 3.203.58 34.596.000 1.805 2.98 tes 2.95 2.92 2.92 204,142 300 3,198.22 5,153,000 1.815 151.492.500 3.214.83 1.805 415 223,400 3.246.32 183,127,000 2.190 48 854,000 311 CAPITA MALLS ASIA: A BUYOUT OFFER FROM CAPITA LAND It was April 15, 2014, and trading had resumed for the shares of Capital and Limited (CapitaLand) a large, Singapore-based real estate compatry, and for the shares of CapitaMalls Asia Limited (CMA), a commercial property development and management company. The trading halt had been called the day before so that Capital and could amounce its vohintary conditional cash offer of SG$2.22 for each share of CMA though its wholly owned subsidiary Sound Investment Holdings Pte Ltd. The intention was to delist CMA and integrate it into the Capital and Group The offer was conditional on Capital and garnering more than 90 per cent of CMAS At the time of the offer, CapitaLand already owned 65.3 per cent of CMA The cash offer of S3.06 billion for the remaining shares was 27 per cent above CMA's one- month volume-weighted average price. The per-share price in the offer was also 20.7 per cent higher than CMA's net aset value per share as at December 31, 2013,' and represented a premium of 22.3 per cent over the closing price of $1.515 on April 11, 2014. The offer price would be reduced for any CMA dividends distributed on or after the announcement date, inchiding a proposed final CMA dividend of $0.0175 per share for the financial year ending in 2013. "If acceptance levels crossed the 96.5 per cent threshold, CapitaLand would be able to compel acquisition of all of CMA's shares. As an investor in CMA, you were congratulating yourself on the unexpected windfall. However, the news also made you wonder about the intrinsic value of CMA When trading resumed on April 15, you noted that CapitaLand's share price had also risen Thals, not only was there a premium for the target shareholders, there was also value created for the acquiring shareholders In fact, you could calculate the estimated synergy anising from the acqusition from the premnim and the net present value of the acquisition CAPITALAND CapitaLand had its headquarters in Singapore and was listed on the Singapore Exchange Limited Its businesses in real estate and real estate fund management were focused in Singapore and China." As of December 31, 2013, the company had assets of $14.91 billion (45 per cent of the group's assets) in China, the conipany's largest market, and assets worth $12.52 billion (38 per cent of the group's assets) in Singapore, which was the company's second-largest market.12 Following a strategie review in 2013, Capital and had been reorganized into four business units: CapitaLand Singapore, Capital and China, CMA and the Ascott Limited (Ascott). CapitaLand Singapore and CapitaLand China developed residential, office, and integrated or mixed-use properties. Despate challenging market conditions, CapitaLand Singapore had almost doubled the mumber of private residential units it sold in 2012 by right-sizing the waits. CapitaLand China bad refined its strategy to focus on mass market and first-time buyers and upgraders and had become the largest foreign real estate developer in China." CMA was in the business of shopping malls, and Ascott in serviced residences. CMA had achieved high shopper traffic and net property income, and in 2013, it announced a partnership to jointly develop the Jewel project at Changi Airport. Ascott, which operated more than 33,000 apartment units across 82 cities in more than 20 comties, s had achieved modest revenue growth in 2013. CAPITA MALLS ASIA LIMITED (CMA) CMA, founded in 2004, went public in November 2009 at an initial offering prae of 52.12 per share and raised $2.3 billion. After this initial public offering, CapitaLand's shareholding interest in CMA was reduced frotu 100 per cent to 65.5 per cent. When it was listed, CMA was one of the largest pure-play shopping mall owners, developers, and managers in Asia its shares closed at $2 30 on the first day of trading CMA used an integrated shopping mall busmess model with interconnected buildings where shoppers could live, work, and play. Its primary business objective was to be a leading owner, developer, and manager of shopping malls in Asia." As of December 2013, CMA had a pan-Asian portfolio of 10 shopping malls valued at $343 billion. It had $1 billion in cash and a debt-to-asset ratio of 25 per cent (see Exhibit 1) MOTIVATION TO DELIST CMA CapitaLand bad several reasons for delistmg CMA. First, because CMA's integrated developinents tended to enjoy high foot traffic from a captive base of offices and residences, the developments were expected to enhance Capital.and's competitive strengths Second delisting CMA would simplify Capital and's organizational structure Third, the delisting would gre CapitaLand more flexibility in allocating its capital and expanding its scale." Fouth, it would unlock shareholder vabe and achieve synergies. Capita Land claimed that the acquisition of CMA would immediately raise earnings per share by approximately 21.5 per cent and improve retum on equity from 5.4 per cent to 6.7 per cent. However, it was not clear whether increasing eamings per share was a good reason for the acquisition President of CapitaLand Lim Ming Ya, said, "The market has changed. Earlier companies were pure-play residential, now companies are emerging that are doing mixed developments, which include homes offices and malls This move will help us compete better 33 According to an analyst at Barclays Plc, "CapitaLand's offer to take CapitaMalls private is a win-win for both CapitaMalls and CapitaLand Regaiting full control of CapitaMalls should allow CapitaLand more flexibility, including the ability to streamline its organizational structure *** However, according to Samsung Asset Management Co Ltd (Samsung Assets), the transaction showed that Capital and could not put the money to better use at a time when the property markets in Singapore and China were starting to weaken. In a similar vein, an investment manager at Samsung Assets in Hong Kong commented, The company is effectively undertaking financial engineering to enhance retums. The problem is these retums are still unsatisfactory relative to the cost of equity and suggests a lack of investment opportunities in an adverse environment of declining property prices in Singapore and slowing growth opportunities in China FINANCIAL PERFORMANCE AND VALUATION To calculate the value of your investment m CMA, you could conduct valuations of CMA's shares using the discounted cash flow (DCF), discounted dividend model (DDM), relative valization (RV), and precedent transaction methods DCF valuation is based on the principle that the value of a business is determined by its ability to generate cash flows. The relationship between the business's revenue and cost drivers can be gleaned from the company's historical financial statements (see Exhibits 1-4 or refer to the student Excel worksheets CMA Financial Statements." and "CapitaLand Financial Statements" [Ivey Publishing product number 7B19N012). These can be used to project a company's cash flows for the initial few years, after wluch a tenminal growth rate can be applied in perpetuity (see Exhibit 5 or refer to the Excel worksheet "Information about CapitaLand'). All projected cash flows will be discounted by the weighted average cost of capital. DCF models provide insights into the drivers of share value, but small changes in inputs can result large changes in intrinsie vahe. 23 The DDM method assumes that a stock is worth the sum of its discounted future dividend payments. The discount rate used is the cost of equity capital. For stocks with a solid history of dividend growth, it is reasonable to assume that the historical growth rate will contime for some years, after which a termal growth rate will be applied (see Exhibits 5 and 6) The DDM is a simple and convenient way of vahing stocks, but it can be sensitive to the assumed growth rates 29 The RV method compares the value of a business to those of its competitors, usmg common multiples or benchmarks such as price-to-eamings (PE), price-to-book (PB), and price-to-sales (P/S) ratios. The PE ratio indicates how much investors are willing to pay per dollar of earrings it is a widely used peer multiple, but because the denominator is eamings, investors have to be carefiil when comparing peers from countries that are subject to different accounting regulations. In addition, PE cannot be applied if eamings are negative The P/B ratio compares a stock's market value to its book value. The ratio is calculated by dividing the price of the stock by the book equity per share. It gives some idea of whether investors are paying a reasonable price for the equity that will be left if the company were to go batiknapt immediately. For example, a P/B ratio of less than one indicates that investors can theoretically buy up all the shares of the company, liquidate the assets pay off the company's liabilities, and stall have money left The PS ratio compares how much investors are willing to pay per dollar of sales. Because sales is a top-line figure and is therefore less affected by accounting policies, tlus is a useful multiple for businesses that have yet to generate positive earnings, and it is useful for comparing businesses that are subject to different accounting regimes. Regardless of which multiple is used it is important to develop accurate benchmarks, and it is crucial to compare only businesses from the same industry and with similar market capitalization Thus, although information had been gathered on a manber of CMA's potential peers (sce Exhibits 7 and 8 or student Excel worksheets "Peer Financial Ratio" and Other Key Peer Financial Data"), further deliberation would be required to identify a suitable comparison group In addition to relative valuation, precedent transactions could also provide some useful information Precedent transaction analysis uses the pnces paid for similar companies to estunate the worth of a target company. Under nomal market conditions, transaction comparable provide higher multiple ranges than peer comparable because acquirers normally pay control premiums and strategic buyers often have the opportunity to realize synergies To assess the value of CMA, information on 12 precedent transactions had been retrieved for consideration (see Exhibit 9 or student Excel worksheet"Precedent Transactions"). PREMIUM, NET PRESENT VALUE, AND SYNERGY By the close of trading on April 15, 2014, Cerita Land's shares had increased 6.5 per cent to $3.11. CMA's shares had surged 21 per cent, from the closing price of Si 815 on April 11, 2014 to $2 19 (see Exhibit 10)the company's biggest gam since going public in 2009 Based on the market response, it appeared that the shareholders of CMA and CapitaLand clearly approved of the transaction. In fact, the net present value of the acquirer could be estimated directly from the response of CapitaLand's share price on April 15th. This, together with the premiumn for the target would provide an estimation of the synergy created EXHIBIT 1: CAPITA MALL ASLA'S BALANCE SHEETS (IN SGS THOUSANDS) 2009 2010 2011 2012 2013 Development Properties 0 0 8,827 0 0 for Sale 436,013 498,281 217,862 533,047 301,773 Trade and Other Receivables Cash and Cash Equivalents $44.306 1,318,312 975,479 675,351 1,004,312 Total Current Assets 980,319 1,816,593 1,202,168 1,208,398 1,306,085 14.686 13197 16 196 17,019 19,304 Plant and Equpment Investment Properties 1,378,567 304,429 618.988 1.565,789 1,546,594 127,666 288,848 1.060.102 548,141 146,934 Property under Development Subsidiaries 0 0 0 0 0 Associates 2999 393 3,119,729 3,521,066 3,671.971 4,195,179 Jomtly Controlled Entities 675,398 1,043 656 1,136,861 2,335,326 2,445,766 Other Investments 200,028 378,653 425,622 441,306 498,469 Other Assets 933 17,072 97,045 143,384 202.441 Total Non-Current Assets 5,396,671 5,165,584 6,875,880 8,722,936 9,054,687 TOTAL ASSETS 6,376,990 6,982,177 8,078,048 9,931,334 10,360,772 Trade and Other Payables 377622 295 396 213 132 240.890 284108 Loans and Borrowings 72.155 12 260 238.938 8.922 157.763 Current Tax Payable 49, 111 58,102 51,448 SS.526 54.976 498,888 365,758 503,518 305,338 496,847 Total Current Liabilities Loans and Borrowings 430,738 687,692 990,805 2,705,490 2.428.283 Deferred Tax Liabilities 30,065 33,121 85,021 88,563 96,524 23,845 7,376 21 579 93,982 70,416 Other Non Current Liabilities Total Non-Current Liabilities 484,648 728,189 1,097,405 2,888.035 2.595,223 TOTAL LIABILITIES 983,536 1,093,947 1.600,923 3,193,373 3,092,070 Share Capital 605.000 4.605 000 4,605 000 4 607 514 4.612 590 4 620 971 Other Reserves 735,041 1,223,519 1,619,477 1,877,757 2.542.797 5,340,041 5,828,519 6,226,991 6,490,347 7,163,768 Equity Attributable to Owners of the Company Non-Controlling Interests Total Equity $3,413 59.711 250 134 247,614 104 934 5,393,454 5,888,230 6,477,125 6,737,961 7,268,702 6,376,990 6,982,177 8,078,048 9,931,334 10,360,772 TOTAL EQUITIES AND LIABILITIES EXHIBIT 2: CAPITA MALL ASIA'S INCOME STATEMENTS (IN SG$ THOUSANDS) 2009 2010 2011 2012 2013 Revenue 228,946 245,402 246.173 361,178 380,416 Cost of Goods Sold -100.246 -91,803 -104,204 -140,389 -140,360 Gross Profit 128.700 153,599 141.969 220,789 240,056 Other Operating Income 85019 82.447 252057 214,677 139 698 Administrative Expenses -70.21 -107,419 -140,401 -151,388 -146,725 -111,901 -1,099 -699 -4,277 -3.602 31,606 127,528 252,926 279,801 229,427 -111,430 -25,603 -33.312 -69,715 -74,015 Other Operating Expenses Profit from Operations Finance Costs Share of Profits from Associates & Joint Ventures Profit before Tax 489 507 475.884 348,945 406,501 $24.769 409,683 577,809 568,559 616,587 680,181 Tax Expense -16.027 -28,871 -74341 -57,739 66 054 Net Income 393,656 548,938 494,218 558,848 614,127 Attributable to: Owners of the Company 368,096 41,337 456,008 S46,018 600,008 5,560 7,601 38,210 12,830 14,119 Non-Controlling Interests Earnings per Share (cents) 201 13 9 11.7 140 154 REAKDOWN OF CAPITAMALL ASIA'S REVENUE BY BUSINESS AND GEOGRAPHICAL SEGMENTS (IN SG$ THOUSANDS) 2009 2010 2011 2012 2013 (Business Segments) Management Business 166,360 Investment Business 135,161 258 005 109.678 102.183 230,790 154,194 166 337 Others 253,768 318,372 94.285 56,224 2.061 1.746 -104,212 -130.169 245,402 2-46,173 2.110 Consolidation Elimination -74,685 -108,688 361,178 |-70905 380,416 Total 228,946 (Geographical Segments) Singapore 84332 120 007 108 679 104,047 78.650 104,412 China 62,879 165,179 2.144 40 581 Malaysia Japan 123036 159,996 37,576 35 639 4,931 361,178 79.134 49.520 28,876 4.699 4,433 3,824 4,405 245,402 246,173 49,259 India 457 5,390 Total 228,946 380,416 EXHIBIT 3: CAPITA LAND'S INCOME STATEMENTS (IN SG$ THOUSANDS) BREAKDOWN OF CAPITA LAND'S REVENUE BY GEOGRAPHICAL SEGMENTS (IN SG$ THOUSANDS) 2009 2010 2011 2012 2013 Singapore 978.9960 1,200,843.0 1,074,765.0 1.169,706.0 1,396,718,0 Chia 773.914.0 711,336.0 665,599.0 587,933.0 1.070,435.0 Other Asian Countries 163,291.0 291,706.0 156,354.0 139,896.0 222,902.0 Australia 755.789.0 916.159.0 890.213.0 1,182.289.0 1,065,689.0 Europe and Others 262 698 0 285,469 0 262 698 0 232 638 0 221 5390 Total 2,957,459.0 3,382,742.0 3,019,569.0 3,301,363.0 3,977,487.0 EXHIBIT 4: CAPITA LAND'S BALANCE SHEETS (IN SG$ THOUSANDS) 2009 2010 2011 2012 2013 Developiticul Properties 3,590,270 5,419,350 6,905,124 7,510.093 7,382,023 Trade and Other Receivables 1,301,916 2.139,625 1,769,374 1,484,753 1,164,115 196,437 203,009 195,000 201,370 196,923 Other Current Assets Cash and Cash Equuvalents 8,729,718 7.190 064 6264473 5,497,693 5.920 152 Total Current Assets 13,818,341 14,952,048 15,133.971 14.693,909 14,663,213 Property, Plant, and Equipment 1,772 301 1.049,407 1,075,SOS 1,263,615 1079,239 Intangible Assets 518 026 459.605 458.222 462,093 470,735 Investment Properties 5,058 507 4,732,895 7,074,617 7.969,402 4,935,194 Associates 7,012,174 8.249.142 9,290,737 9,692,297 11,750.550 Joint Ventures 1,672,056 1.861,232 1,394,263 2.818,985 2,525,352 Deferred Tax Assets 81,250 308,205 95,671 91,595 73.477 Other Non-Current Assets 233,359 87,686 795.955 795,713 657,124 - - Total Non-Current Assets 16,347.673 16,748,172 20,185,470 23,093,700 21,491,671 TOTAL ASSETS 30,166,014 31,700,220 35,319,441 37,787,609 36,154,884 Trade and Other Payables 1,880,017 1,694,385 2,270,488 2,359,598 2,680 483 Short-Temn Bank Borrowings 992 974 852,255 426,011 765,826 1939,310 404,612 909,519 434,228 16,346 254,972 Current Portion of Debt Securities Current Tax Payable 457.374 496,405 441,075 432,489 472,711 Total Current Liabilities 3,734,977 3,952,564 3,571,802 3,574,259 4,347,476 Long-Tem Bank Borrowings 3,951,770 3,798,410 6,105,790 6,617,114 5,421,543 Debt Securities 4,963,198 4,797,859 5,224,610 6,780,492 5.946 962 Deferred Tax Liabilities 173,756 593,238 627,638 656,989 1611,133 Other Non-Current Liabilities 462,550 540,687 550,130 712,971 516,827 Total Non-Current Liabilities 9,551,274 9,730,194 12,508,168 14,769,566 12,496,465 TOTAL LIABILITIES 13,286,251 13,682,758 16,079.970 18,343,825 16,843,941 Share Capital 6,229 227 6,276,504 6,298 355 6 300 011 6 302 207 Revenue Reserves 6,839 047 7.652 261 8,328.115 8,910,445 9,429 976 Other Reserves 339 999 241 886 275,067 -130,018 335 726 Equity Attributable to Owners 13,408,273 14170651 14,901,537 15 080 408 16.067 909 Non-Controlling Interests 3,471,490 3,846,811 4,337,934 4,363,376 3.243,034 Total Equity 16,879,763 18,017,462 19,239,471 19,443,784 19,310,943 TOTAL EQUITIES & LIABILITIES 30,166,014 31,700,220 35,319,441 37,787,609 36,154,884 EXHIBIT 5: OTHER INFORMATION ABOUT CAPITALAND AND CAPITAMALL ASIA CapitaLand CapitaMall Asia Cost of Debt 2.3244 2 5842 Cost of Equity 11 95745003 8 44892252 Beta 1.144 0670 Number of Shares 4,255,980,000 3.909 675.00 Terminal Growth Rate (assumed) 3% Dividend History Payout Ratio" (%) CapitaLand Payout Ratio (%)CapitaMalls Asia Year 2006 32 1673 2002 15.2538 2008 23.5455 2009 42.3568 9.9975 2010 17.9704 18.4164 2011 32.1098 25.5478 2012 31 9881 23 1494 2013 42.2338 22 6992 EXHIBIT 6: HISTORICAL AND FORECASTED GDP GROWTH RATES (IN USS THOUSANDS) Forecasted 2011 2012 2013 2014 2015 2016 2017 2018 Global GDP 72,6116 76.330 8 78,1690 73.591.4 74,996.6 76,259.4 79,925.8 174,492.8 2.6 11.4 2.5 2.4 -5.9 1.9 1.7 14.8 Growth YoY (9) Europe GDP 13,618.9 13.421.4 11,825.5 12,626. -7.3 13,172.4 4.3 11,5921 -13.6 11,331.2 -4.2 11,583.7 2.2 7.8 1.9 2.0 Growth YoY (9) Asia GDP 24 1672 21.663.4 SO 23,3673 SO 23,4753 51 24 1986 01 25 3170 4.6 26,6043 5.1 28 0081 53 4.9 Growth YoY (%) Australia GDP 1.503.7 1,500.4 1.448.4 11.219.1 1,252.2 1,295.3 11,5590 3.7 1,3079 10 20.6 |-3.8 -3.5 -15.8 2.7 3.7 Growth YoY (%) China GDP 10.6550 11,826.1 7.438.5 23.8 8,5422 14.8 9,793.7 14.7 11,255 4 5.6 11,5980 2.2 12,420.8 5.0 8.8 2.8 Growth YoY (%) Singapore GDP 2671 2928 3224 2966 11.0 299 4 1.0 2782 -5.0 284.9 2.4 299 6 5.2 13.0 -2.2 7.6 Growth YoY (%) EXHIBIT 7: FINANCIAL RATIOS AND NATURE OF OPERATIONS OF POTENTIAL PEERS Current Ratio Quick Ratio Solvency Ratio Debt! Equity Equity Multiplier 0.00 Effective Tax Rate Bukit Sembawang Estates 16.61 2.12 0.55 0.00 1981 City Developments Ltd 3.57 1.18 0.12 51.82 30.16 7.34 Frasers Centrepoint Litted 2.41 0.29 10.03 32.94 17.28 11.60 3.43 2.94 0.18 31.86 21.76 15.02 Global Logistic Properties Hongkong Land Holdings Ltd 1.99 067 0.22 1647 1343 1158 Pollux Properties Ltd 4.81 0.41 0 06 151 03 $789 67 45 Sinamas Land Ltd 2.43 0.19 0 09 24.54 15.97 11 36 Tuan Sing Holdings Ltd 3.21 1.36 10.04 120.87 51.46 15.48 UIC-United Indust Corp Ltd 1.52 0.21 0.24 15.77 13.09 6.85 UOL Group Ltd 1.30 10.74 0.25 32.09 22.25 7.40 Wheelock Properties (SGP) 11 66 3.16 0.06 21.04 16.66 20.42 Wing Tai Holdings Ltd 5 63 2.32 0 16 14753 28.90 1490 Yanlord Land Group Ltd 2.22 0.39 0 06 62.13 28.17 4403 Yuexiu Property Co Ltd 1.83 0.16 0.04 94.85 30.57 40.83 Gross Margin Net Margin Total Asset Turnover Inventory Turnover Receivable Turnovet Payable Turnove 41.53 32 33 0.28 0.19 22.23 28.67 Bukit Sembawang Estates City Developments Ltd $1.60 21.40 0.18 0.36 27.93 8.85 Frasers Centrepoint Limited 39.54 35.19 10.20 0.27 16.64 4.37 Global Logistic Properties 107.04 0.05 25.79 53.79 64.06 10.06 0.33 38.69 2.99 Hongkong Land Holdings Ltd Pollux Properties Ltd 24.71 0.91 0.09 0.09 3,378.06 9.72 Sinannas Land Ltd 65.93 24.51 10.29 0.80 100.13 19.08 Tuan Sung Holdings Ltd 16.96 17.20 0.17 0.59 6.74 17.44 UIC United Indust Corp Ltd 45.26 $184 007 037 10 OS S.80 UOL Group Ltd 48 08 7621 lo 10 0 56 2 69 Wheelock Properties (SGP) 76.19 34.20 0.03 0.03 65.19 9.97 Wing Tai Holdings Ltd 41.48 39.86 0.27 0.60 16.48 34.31 35.46 13.07 0.18 0.25 250.18 3.50 Yanlord Land Group Ltd Yuexni Property Co Ltd 28.89 20.27 0.18 0.25 825 21 330.36 EXHIBIT 7: (CONTINUED) ROA ROE P/E P/B P/S Bukit Sembawang Estates 8.52 10.19 16.03 1.59 5.18 City Developments Ltd 9.37 12.97 1.18 2.72 Frasers Centrepoint Limited 6.94 13.93 825 0.42 1.43 Global Logistic Properties 3.10 8.46 15.10 1.20 15.39 Hongkong Land Holdings Ltd 3.67 4.49 11.67 0.52 7.47 Pollux Properties Ltd 0.08 0.20 3.65 0.98 4.33 Sinamas Lund Lid 7.81 19.81 5.05 1.03 1.24 3.29 7.14 6.67 0.47 1.16 4.00 6.54 12.97 0.82 6.72 7.86 12.18 607 0.71 4.62 Tuan Sing Holdings Ltd UTC United Indust Corp Ltd UOL Group Ltd Wheelock Properties (SGP) Wing Tai Holdings Ltd Yamlord Land Group Ltd 1.09 1.31 50.60 0.65 17.32 11.82 20.94 3.02 0.57 1.21 2.55 8.60 7.77 0.64 1.01 Yuexiu Property Co Ltd 3.89 12.43 1.69 0.08 0.13 EXHIBIT 8: KEY FINANCIAL DATA OF POTENTIAL PEERS Book Debt Cost of Shure Price (SGS) Shares Outstanding (millions) Sales (SG$ millions) Earnings (SGS millions) Book Equity (SGS millions) Debt (%) (SG$ millions) Cost of Equity (%) Financial Year End Company Month March 5.420 258.911 281.997 91.979 0.000 0.000 1,289.832 6.530 Bukit Sembawang Estates City Developments Ltd December 9.600 909.301 3,905.453 653.214 5,737.767 2178 11,408.684 8.427 September 1.700 2,899.996 3,439.592 597.219 9.795.537 2.239 11,843.484 6.257 March 2.650 4,743.686 960.183 904823 6.002.647 2.207 16,559 382 9.488 Frasers Centrepoint Limited Global Logiste Properties Hongkong Land Holdings Ltd Pollux Properties Ltd December 5.900 2.352.800 2,473.395 4,151.022 4,858.221 2.261 38.844.924 10.629 March 0.079 627.115 45.271 1.656 53930 2014 50.784 8.091 Sinarmas Land Ltd December 0.480 4.255.862 878.388 114.908 1,358.917 2.451 3.855.296 8.130 Thuan Sing Holdings Ltd December 0.300 1,182.800 404.018 33.585 1,020.793 2.660 930.456 7.101 December 2.970 1.419.089 1,036.584 286.045 1.241 628 1.198 7,035.062 5.206 December 6.190 804.611 1,410.558 287.040 2,409.443 2.267 8.635,364 8.691 December 1.695 1.196.560 769.673 58.349 0.000 0.000 2.989.286 7.043 UIC-United Indust Corp Ltd UOL Group Ltd Wheelock Properties (SGP) Wing Tai Holdings Ltd Yatilord Land Group Ltd Yuexiu Property Co Ltd June 1.970 772 509 544.390 7.079 1,376,506 1.749 3,332 526 7.308 December 1.225 1.941.586 5,351.540 562 453 4,726,304 1.474 6,257 589 6.728 December 0.058 9.322.031 4,352.023 321.153 8,401.949 2.312 7.170.139 10.477 EXHIBIT 9: PRECEDENT TRANSACTIONS Announce Date Deal Description Target Name Target Country Acquirer Name Announced Total Value (USS millions) Announced Premium August 24 2004 PL. Retail LLC acquired Price Legacy Corp for USS 1,241.08 million. The transaction was announced on August 24, 2004, and completed on December 22, 2004 Price Legacy Corp United States PL Retail LLC PL Retail LLC 1,241.1 2.8% December 20, 2004 Kramont Realty Trust United States CNPR Group 1.1039 17.1% CNPR Group acquired Kramont Realty Trustfor US$1,103,89 million. The transaction wasannomced on December 20, 2004, and completed on Apnl 19 2005 Kamco Realty Corp. acquired Pan Pacific Retail Properties Inc. for US$3,867.52 million. The transaction was announced on July 10, 2006, and completed on October 31, 2006 Kimco Realty July 10, 2006 . Pan Pacific Retail Properties Inc United States 3,867.5 1.3% July 10, 2006 CNPR Group acquired Heritage Property Itvestment Trust Inc for USS3,203 71 million. The transaction was Heritage Property Investment Trust Inc United States CNPR Group 3.203.7 7.5% announced on July 10, 2006, and completed on October 6, 2006. October 23, 2006 Inland Retail Real Estate Trust Inc. United States DDR Corp. acquired Inland Retail Real Estate Trust Inc. for US$5,871.46 million. The transaction was announced on October 23, 2006, and completed on February 27, 2007 DDR Corp 5.871.5 21.4% February 27, 2007 CNPR Group CNPR Group acquired Brixmor LLC for US$5,234.05 million The transaction was announced on February 27, 2007, and completed on April 23, 2007. As of the completion date, this was CNPR Group's largest acquisition on record Bremor LLC United States Brixmor LLC United States 5.2341 France France Banques April 3, 2007 Foncia Groupe SAS 6903 0.8% Banques Populaires France acquired FonciaCroupe SAS for 516.75 nullion. The transaction was announced on April 3, 2007, and completed on May 10, 2007. Populaires France Landic Property hf acquired Landic Property A/S for 7925 June 29, 2007 DKK4.356.53 million. The transactiouwas announced on Landie PropertyA/S Detumark Landic Property hf 11.0% Time 29, 2007, and completed on September 20, 2007 Conwert June 15, 2010 ECO Business Immobilien AG Germany Conwert Immobilien Invest GmbH acquiredECO Business-Immobilen AG for 629 10 million. The transaction was announced on June 15, 2010, and completed on November4, 2010. Innobilien Invest. GmbH 775 7 38.8% October 4, 2010 British Columbia Investment Management Corp acquired Parkbridge Lifestyle Communities Inc for CAS787.09M. The transaction was announced on October 4, 2010, and completed on January 12, 2011. Parkbridge Lifestyle Communities Inc Canada British Columbia Investment Management Corp 7692 33.4% March 10, 2011 EDT Retail Trus EDT Retail Trust Australia Elbit Imaging Ltd Plaza Centers NV Eastgate Property LLC A consortium led by Elbit Imaging Ltd acquired EDT Retail Trust for AUS1.189.17million. The transaction was announced on March 10, 2011, and completed on September 6, 2011 Australia 1.191.2 22.6% Primaris Retail January 16, 2013 H&R Real Estate Investment Trust acquired Primaris Retail Real Estate Investment Trust for CAS4 049 52 million. The transaction was announced on January 16, 2013, and completed on April 9, 2013. Through the acquisition, H&R became Canada's largestREIT by enterprise value Real Estate Canada H&R Real Estate Investment Trust 4.1058 5.0% Investment Trust EXHIBIT 10: VOLUME AND PRICE DATA (PRICE IN SGS) Straits Times Index Capital Malls Asia Capita Land Date Volume Points Volume Price Per Volume Price Per Traded Traded Share Traded 197,530,100 3,198.52 1.790 April 1, 2014 April 2, 2014 April 3, 2014 Share 2.91 2.94 342.589,000 3,192.78 1.760 329,078,400 April 4, 2014 10,032.000 16,613,000 8,902.000 5,652.000 5,235,000 6,573,000 3,220 06 3.212.72 3,193.59 182,690,000 14.96 2.96 1.755 755 11.755 1.735 725 1.750 750 201,864,700 18,422,000 15,257,000 9,337,000 5,593,000 5,349,000 10,133,000 6,759,000 8,250,000 10,538,000 2.96 268.919 3,204.09 2.98 320,399.100 3,209.92 10,054.000 April 7, 2014 April 8, 2014 2014 . April 9, 2014 April 10, 2014 April 11, 2014 April 14, 2014 April 15, 2014 1.760 318,300,500 3.203.58 34.596.000 1.805 2.98 tes 2.95 2.92 2.92 204,142 300 3,198.22 5,153,000 1.815 151.492.500 3.214.83 1.805 415 223,400 3.246.32 183,127,000 2.190 48 854,000 311
Step by Step Solution
There are 3 Steps involved in it

Get step-by-step solutions from verified subject matter experts