Question: QUESTION Calculate the following ratios and include the workings (MTN: Use the IFRs Impact 16 figures, June 2019 statement.) Operating profit percentage; Net profit percentage;
QUESTION
Calculate the following ratios and include the workings (MTN: Use the IFRs Impact 16 figures, June 2019 statement.)
Operating profit percentage; Net profit percentage; Return on asset; Return on
Total Equity; Total asset turnover; Total Debt/Equity ratio; Total Debt/Total asset
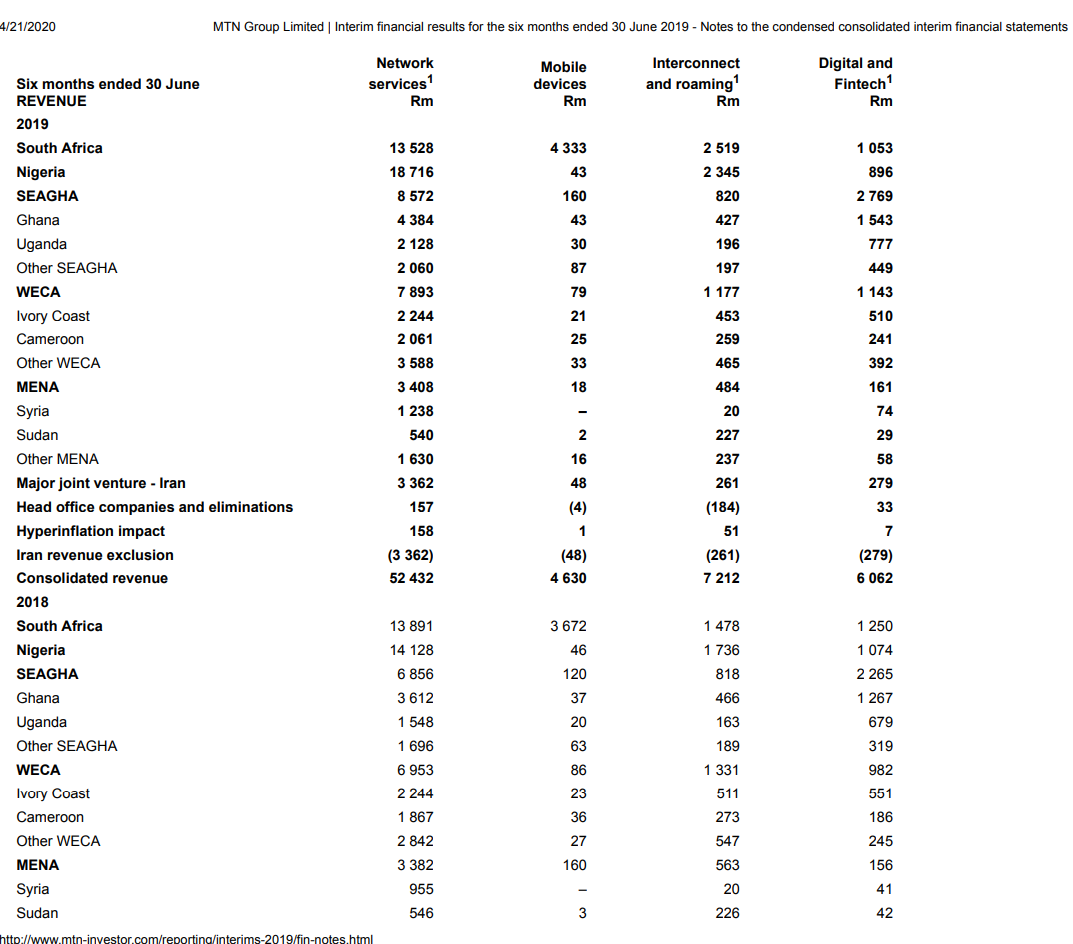

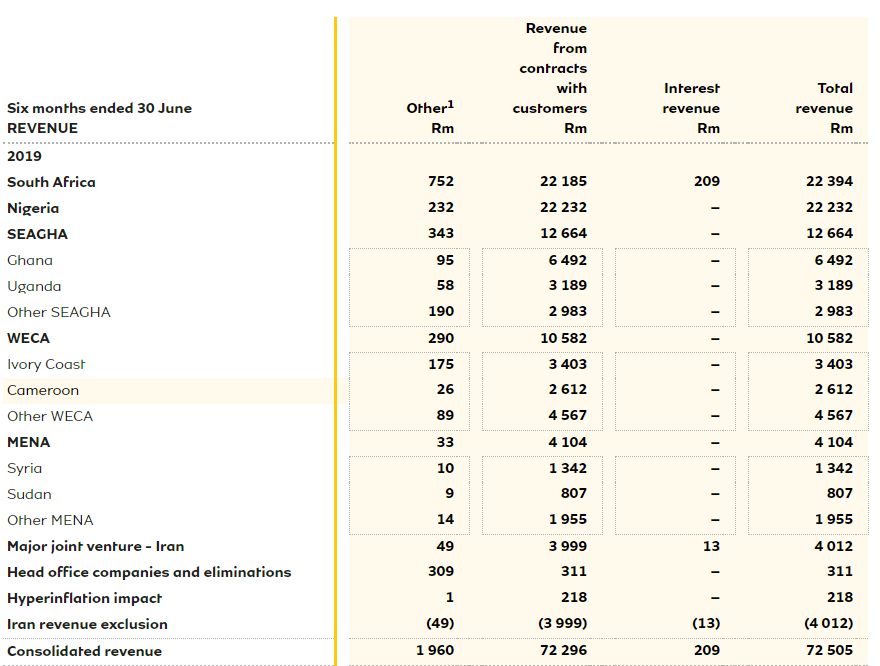
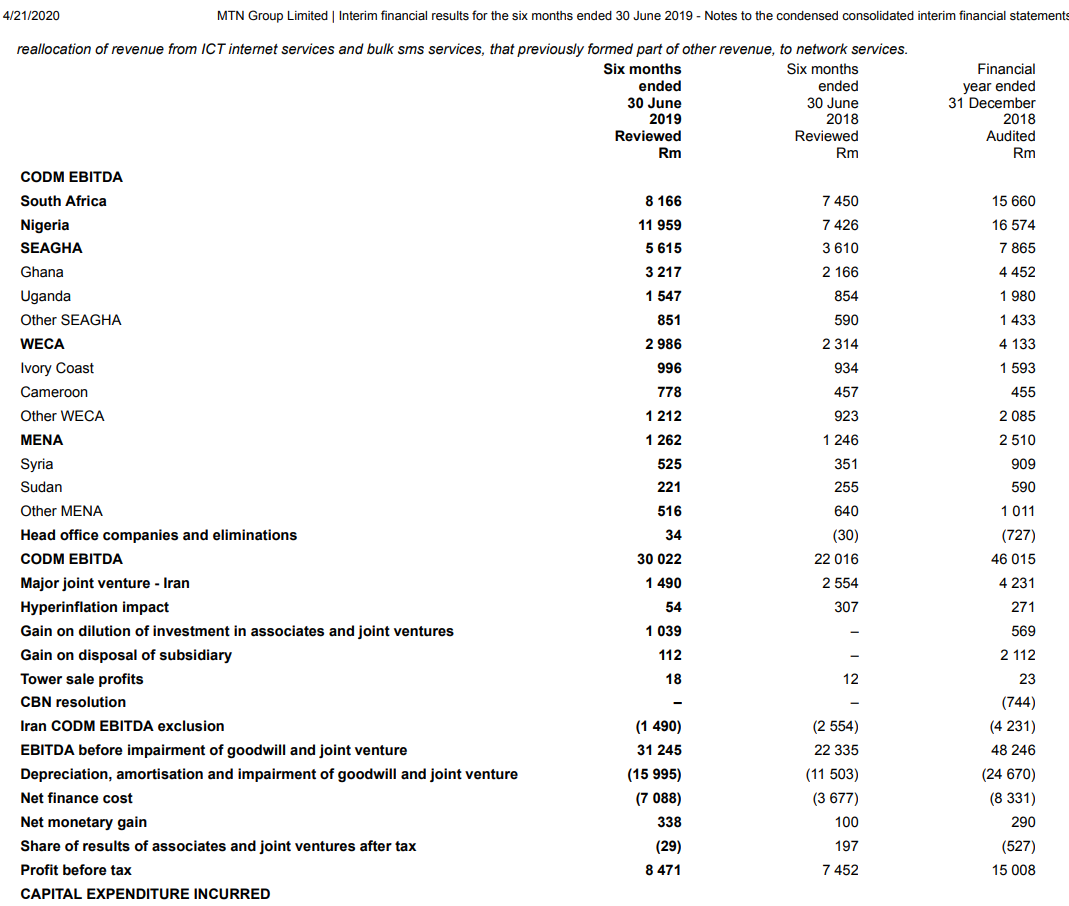
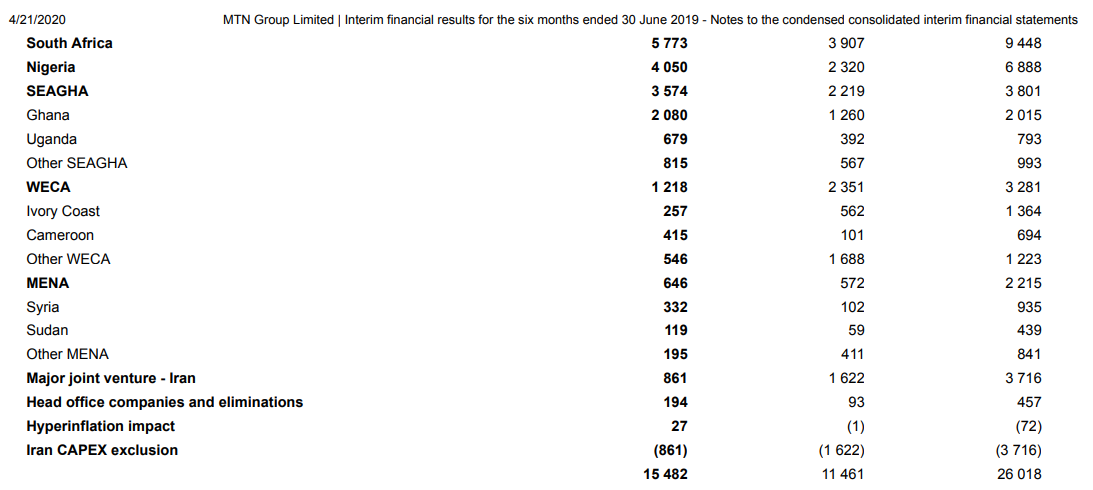
QUESTION
Calculate the following ratios and include the workings (MTN: Use the IFRs Impact 16 figures, June 2019 statement.)
Operating profit percentage; Net profit percentage; Return on asset; Return on
Total Equity; Total asset turnover; Total Debt/Equity ratio; Total Debt/Total asset
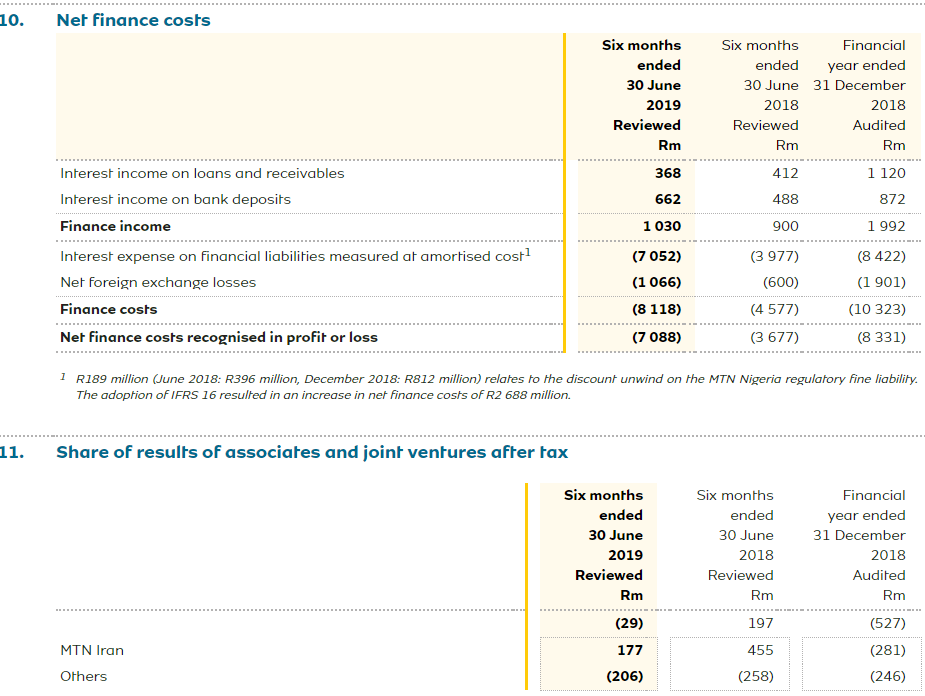
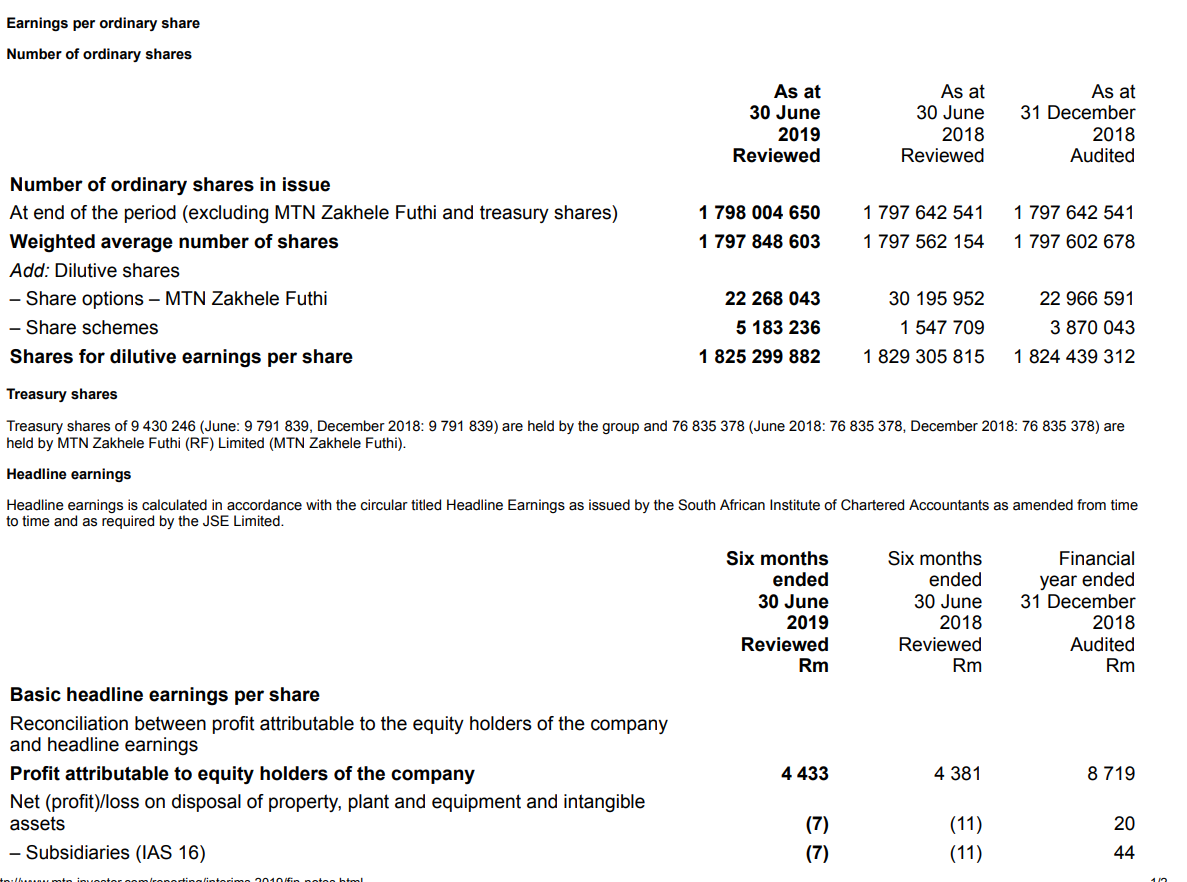
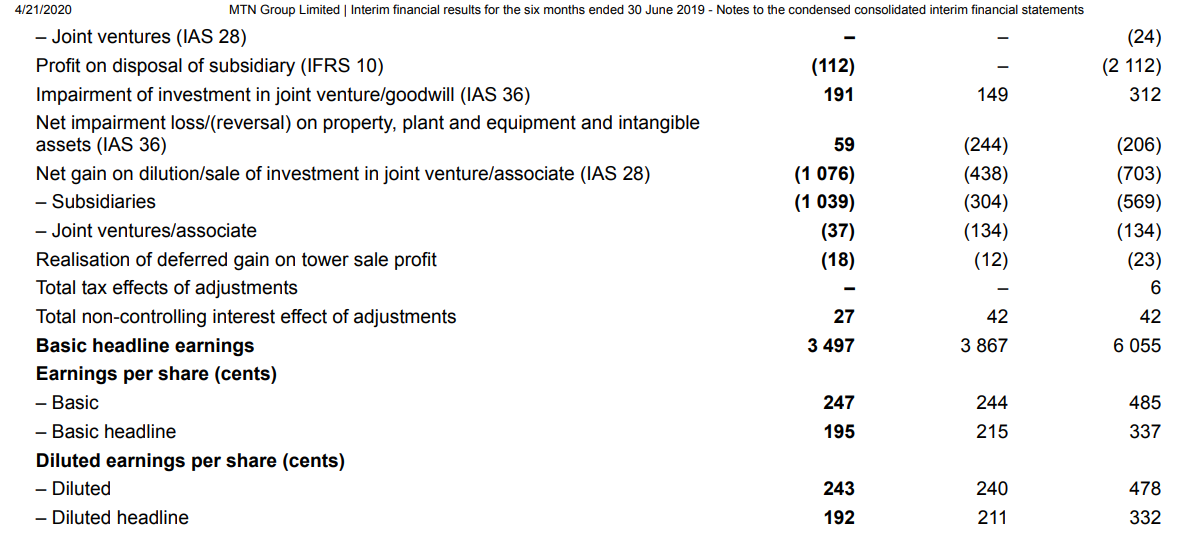
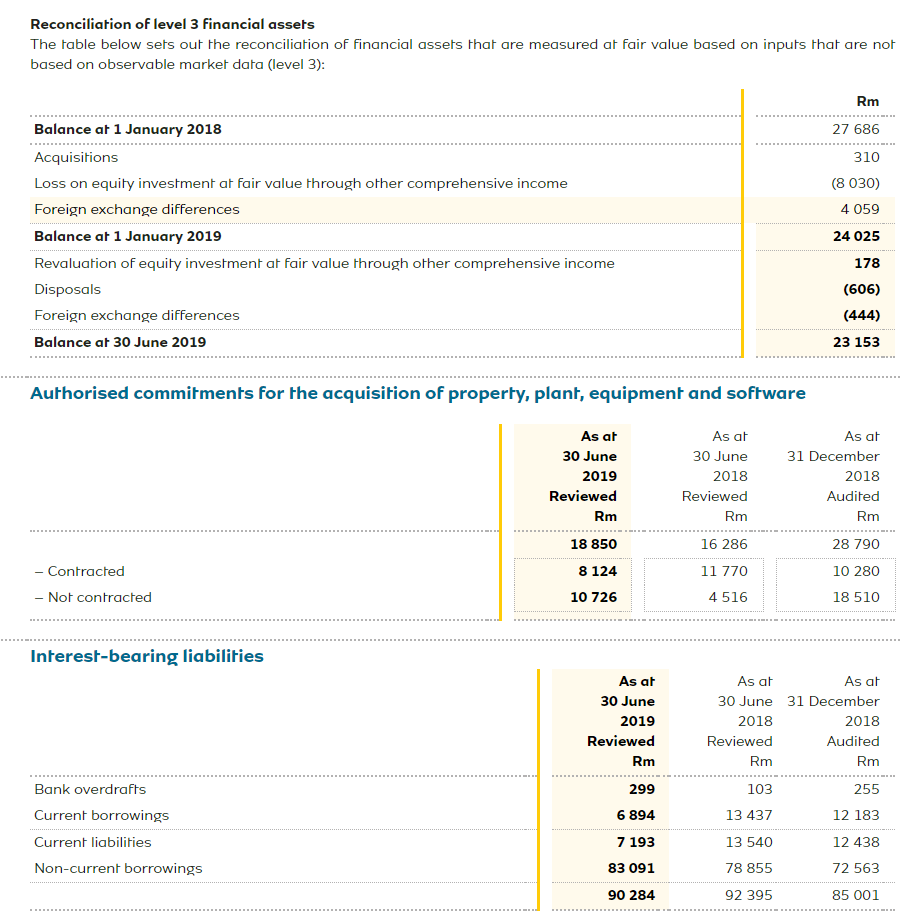
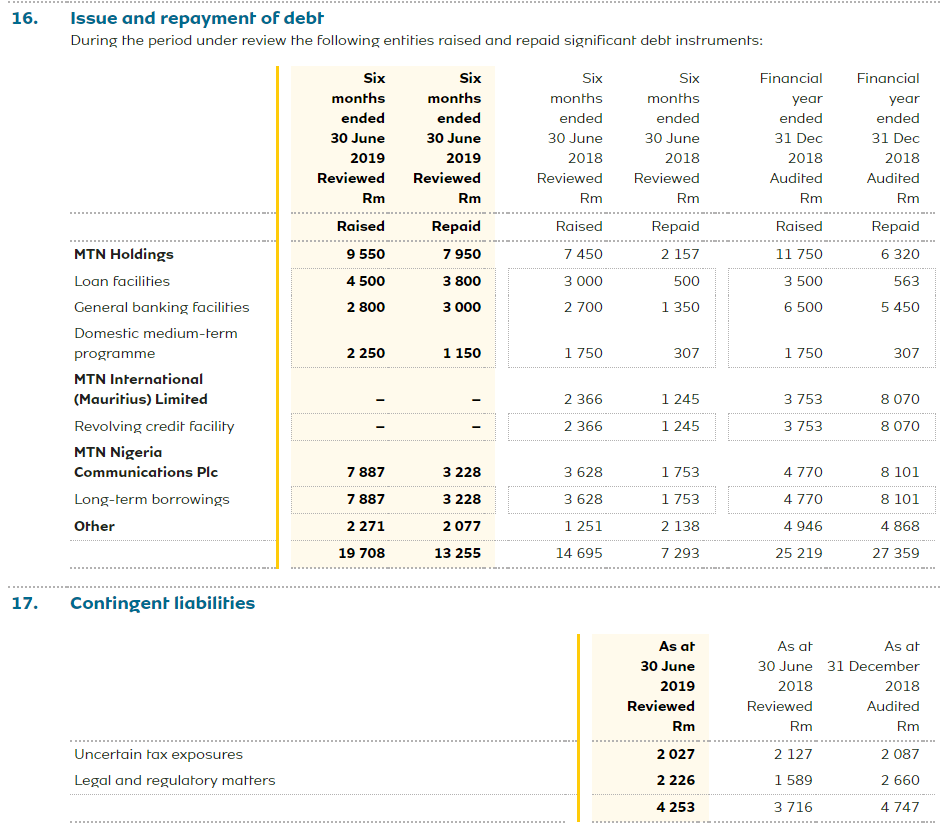
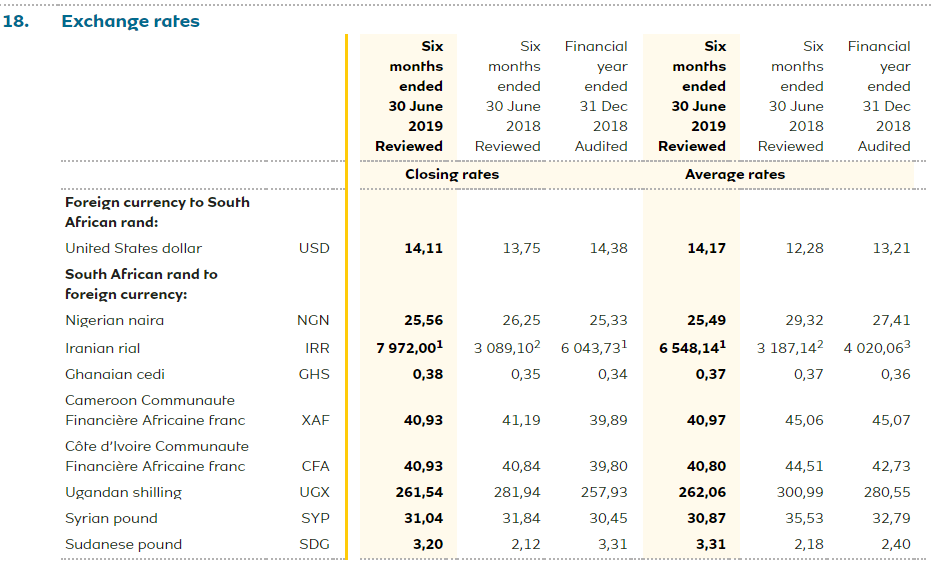
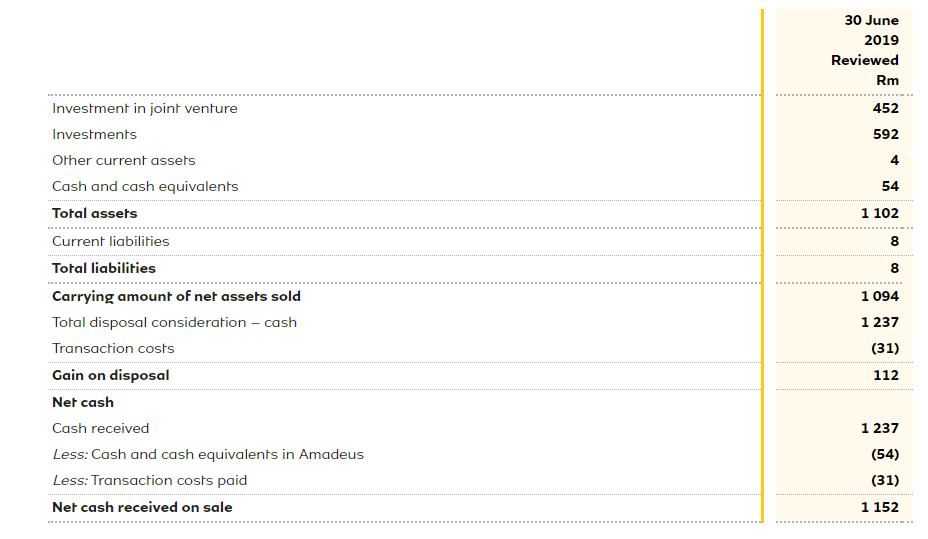
4/21/2020 MTN Group Limited Interim financial results for the six months ended 30 June 2019 - Notes to the condensed consolidated interim financial statements Network services Rm Mobile devices Rm Interconnect and roaming Rm Digital and Fintech Rm Six months ended 30 June REVENUE 2019 South Africa 4 333 1 053 2 519 2 345 896 820 196 197 2 769 1 543 777 449 1 143 510 1 177 453 259 13 528 18 716 8 572 4 384 2 128 2060 7 893 2 244 2 061 3 588 3 408 1 238 540 1 630 3 362 157 158 (3 362) 52 432 465 484 Nigeria SEAGHA Ghana Uganda Other SEAGHA WECA Ivory Coast Cameroon Other WECA MENA Syria Sudan Other MENA Major joint venture - Iran Head office companies and eliminations Hyperinflation impact Iran revenue exclusion Consolidated revenue 2018 South Africa Nigeria SEAGHA Ghana Uganda Other SEAGHA WECA Ivory Coast Cameroon Other WECA MENA Syria Sudan 20 227 237 261 (184) 51 (261) 7 212 33 (48) 4 630 (279) 6 062 3 672 1 250 1 074 2 265 13 891 14 128 6 856 3 612 1 548 1 696 6 953 2 244 1 478 1 736 818 466 163 189 1 267 679 319 1 331 982 511 1 867 273 563 2 842 3382 955 546 226 http://www.mtn-investor.com/reportina/interims-2019/fin-notes.html 4/21/2020 MTN Group Limited | Interim financial results for the six months ended 30 June 2019 - Notes to the condensed consolidated interim financial statements Other MENA 1 881 157 317 73 Major joint venture - Iran 5536 513 728 Head office companies and eliminations (17) (202) Hyperinflation impact Iran revenue exclusion (5 536) (513) (728) Consolidated revenue 45 242 4 087 5 735 5 73 49 (92) Revenue from contracts with customers Rm Other Six months ended 30 June REVENUE Interest revenue Rm Total revenue Rm Rm 752 209 232 22 185 22 232 12 664 343 2019 South Africa Nigeria SEAGHA Ghana Uganda Other SEAGHA WECA Ivory Coast 22 394 22 232 12 664 6 492 3 189 2 983 95 58 190 290 6 492 3 189 2 983 10 582 175 Cameroon Other WECA MENA 3 403 2 612 4567 4 104 10 582 3 403 2 612 4567 4 104 1 342 807 1955 3 999 311 218 (3 999) 72 296 1 342 807 1 955 Syria Sudan Other MENA Major joint venture - Iran Head office companies and eliminations Hyperinflation impact Iran revenue exclusion Consolidated revenue 49 309 4 012 311 218 (4 012) 72 505 (49) 1 960 (13) 209 4/21/2020 MTN Group Limited | Interim financial results for the six months ended 30 June 2019 - Notes to the condensed consolidated interim financial statements Financial year ended 31 December 2018 Audited Rm 15 660 16 574 7 865 4 452 1 980 854 1 433 2 314 4 133 457 reallocation of revenue from ICT internet services and bulk sms services, that previously formed part of other revenue, to network services. Six months Six months ended ended 30 June 30 June 2019 2018 Reviewed Reviewed Rm Rm CODM EBITDA South Africa 8 166 7 450 Nigeria 11 959 7 426 SEAGHA 5615 3 610 Ghana 3 217 2 166 Uganda 1 547 Other SEAGHA 851 590 WECA 2 986 Ivory Coast 996 934 Cameroon 778 Other WECA 1 212 923 MENA 1 262 1 246 Syria 525 351 Sudan 221 255 Other MENA 640 Head office companies and eliminations (30) CODM EBITDA 30 022 22016 Major joint venture - Iran 1 490 2 554 Hyperinflation impact 54 Gain on dilution of investment in associates and joint ventures 1 039 Gain on disposal of subsidiary 112 Tower sale profits CBN resolution Iran CODM EBITDA exclusion (1 490) (2 554) EBITDA before impairment of goodwill and joint venture 31 245 22 335 Depreciation, amortisation and impairment of goodwill and joint venture (15 995) (11 503) Net finance cost (7 088) (3 677) Net monetary gain 338 100 Share of results of associates and joint ventures after tax 197 Profit before tax 8 471 7 452 CAPITAL EXPENDITURE INCURRED 1 593 455 2 085 2 510 909 590 1 011 (727) 46 015 4 231 271 516 34 569 2 112 23 (744) (4 231) 48 246 (24 670) (8 331) 290 (527) 15 008 (29) 793 415 4/21/2020 MTN Group Limited | Interim financial results for the six months ended 30 June 2019 - Notes to the condensed consolidated interim financial statements South Africa 5 773 3 907 9 448 Nigeria 4 050 2 320 6 888 SEAGHA 3 574 2 219 3 801 Ghana 2 080 1 260 2015 Uganda 679 392 Other SEAGHA 815 567 993 WECA 1 218 2 351 3 281 Ivory Coast 257 562 1 364 Cameroon 101 694 Other WECA 546 1 688 1 223 MENA 646 2 215 Syria 332 935 Sudan 119 439 Other MENA 195 411 841 Major joint venture - Iran 861 1 622 3 716 Head office companies and eliminations 194 457 Hyperinflation impact (72) Iran CAPEX exclusion (861) (1 622) (3 716) 15 482 11 461 26 018 102 59 93 10. Net finance costs Six months ended 30 June 2019 Reviewed Rm Six months Financial ended year ended 30 June 31 December 2018 2018 Reviewed Audited Rm Rm 412 368 662 1 120 872 488 1 030 900 1992 Interest income on loans and receivables Interest income on bank deposits Finance income Interest expense on financial liabilities measured at amortised cost1 Net foreign exchange losses Finance costs Net finance costs recognised in profit or loss (7052) (1 066) (8 118) (7088) (3 977) (600) (4 577) (3677) (8 422) (1 901) (10 323) (8 331) 1 R189 million (June 2018: R396 million, December 2018: R812 million) relates to the discount unwind on the MTN Nigeria regulatory fine liability The adoption of IFRS 16 resulted in an increase in net finance costs of R2 688 million. 11. Share of results of associates and joint ventures after tax Six months ended 30 June 2019 Reviewed Rm (29) 177 (206) Six months ended 30 June 2018 Reviewed Rm Financial year ended 31 December 2018 Audited Rm MTN Iran Others 197 455 (258) (527) (281) (246) Earnings per ordinary share Number of ordinary shares As at 30 June 2019 Reviewed As at 30 June 2018 Reviewed As at 31 December 2018 Audited 1 798 004 650 1 797 848 603 1797 642 541 1797 642 541 1797 562 154 1797 602 678 Number of ordinary shares in issue At end of the period (excluding MTN Zakhele Futhi and treasury shares) Weighted average number of shares Add: Dilutive shares - Share options - MTN Zakhele Futhi - Share schemes Shares for dilutive earnings per share 22 268 043 5 183 236 1 825 299 882 30 195 952 22 966 591 1 547 709 3 870 043 1829 305 8151 824 439 312 Treasury shares Treasury shares of 9 430 246 (June: 9 791 839, December 2018: 9 791 839) are held by the group and 76 835 378 (June 2018: 76 835 378, December 2018: 76 835 378) are held by MTN Zakhele Futhi (RF) Limited (MTN Zakhele Futhi). Headline earnings Headline earnings is calculated in accordance with the circular titled Headline Earnings as issued by the South African Institute of Chartered Accountants as amended from time to time and as required by the JSE Limited. Six months ended 30 June 2019 Reviewed Rm Six months ended 30 June 2018 Reviewed Rm Financial year ended 31 December 2018 Audited Rm Basic headline earnings per share Reconciliation between profit attributable to the equity holders of the company and headline earnings Profit attributable to equity holders of the company Net (profit)/loss on disposal of property, plant and equipment and intangible assets - Subsidiaries (IAS 16) 4.433 4 381 8719 (7) (11) (11) 20 tohoto votor conocistiotori i soto bol A (24) (2 112) 312 4/21/2020 MTN Group Limited | Interim financial results for the six months ended 30 June 2019 - Notes to the condensed consolidated interim financial statements - Joint ventures (IAS 28) Profit on disposal of subsidiary (IFRS 10) (112) Impairment of investment in joint venture/goodwill (IAS 36) 191 149 Net impairment loss/(reversal) on property, plant and equipment and intangible assets (IAS 36) 59 (244) Net gain on dilution/sale of investment in joint venture/associate (IAS 28) (1 076) (438) - Subsidiaries (1 039) (304) - Joint ventures/associate (37) (134) Realisation of deferred gain on tower sale profit (12) Total tax effects of adjustments Total non-controlling interest effect of adjustments 27 42 Basic headline earnings 3 497 3 867 Earnings per share (cents) - Basic 247 244 - Basic headline 215 Diluted earnings per share (cents) - Diluted 243 - Diluted headline 192 211 (206) (703) (569) (134) (23) (18) 'S '**** 42 6 055 195 485 337 240 478 332 Reconciliation of level 3 financial assets The table below sets out the reconciliation of financial assets that are measured at fair value based on inputs that are not based on observable market data (level 3): Rm Balance at 1 January 2018 27 686 310 (8 030) 4 059 Acquisitions Loss on equity investment at fair value through other comprehensive income Foreign exchange differences Balance at 1 January 2019 Revaluation of equity investment at fair value through other comprehensive income Disposals Foreign exchange differences Balance at 30 June 2019 24 025 178 (606) (444) 23 153 Authorised commitments for the acquisition of property, plant, equipment and software As at As at 30 June 2019 Reviewed Rm 18 850 8 124 10 726 30 June 2018 Reviewed Rm As at 31 December 2018 Audited Rm 16 286 28 790 - Contracted - Not contracted 11 770 4 516 10 280 18 510 Interest-bearing liabilities As at 30 June 2019 Reviewed Rm As at As at 30 June 31 December 2018 2018 Reviewed Audited Rm Rm 299 Bank overdrafts Current borrowings 255 12 183 6 894 Current liabilities Non-current borrowings 7 193 83 091 103 13 437 13 540 78 855 92 395 12 438 72 563 85 001 90 284 16. Issue and repayment of debt During the period under review the following entities raised and repaid significant debt instruments: Six months ended 30 June 2018 Reviewed Six months ended 30 June 2019 Reviewed Rm Raised 9 550 4 500 2 800 Six months ended 30 June 2019 Reviewed Rm Repaid 7 950 3 800 3 000 Six months ended 30 June 2018 Reviewed Rm Raised 7 450 3 000 2 700 Financial year ended 31 Dec 2018 Audited Rm Rm Financial year ended 31 Dec 2018 Audited Rm Raised 11 750 3 500 6 500 MTN Holdings Repaid 2 157 500 1 350 Repaid 6320 563 5 450 2 250 1 150 1750 307 1750 307 Loan facilities General banking facilities Domestic medium-term programme MTN International (Mauritius) Limited Revolving credit facility MTN Nigeria Communications Plc Long-term borrowings Other 2 366 2 366 1 245 1245 3 753 3 753 8070 8 070 8 101 1753 1 753 7 887 7 887 2 271 19 708 3 228 3 228 2077 13 255 3628 3 628 1 251 14 695 4 770 4 770 4 946 25 219 2 138 946 8 101 4 868 27 359 7 293 17. Contingent liabilities As at 30 June 2019 Reviewed Rm As at As at 30 June 31 December 2018 2018 Reviewed Audited Rm Rm 2 127 2087 1 589 2 660 3716 4 747 Uncertain tax exposures Legal and regulatory matters 2 027 2 226 4 253 18. Exchange rates Six Six Six months months ended ended 30 June 30 June 2019 2018 Reviewed Reviewed Closing rates Financial year ended 31 Dec 2018 Audited Six months months ended ended 30 June 30 June 2019 2018 Reviewed Reviewed Average rates Financial year ended 31 Dec 2018 Audited USD 14,11 13,75 14,38 14,17 12,28 13,21 Foreign currency to South African rand: United States dollar South African rand to foreign currency: Nigerian naira Iranian rial Ghanaian cedi Cameroon Communaute Financire Africaine franc Cte d'Ivoire Communaute Financire Africaine franc Ugandan Shilling Syrian pound Sudanese pound NGN IRR GHS 25,56 7 972,001 0,38 26,25 25,33 3 089,102 6043,731 0,35 0,34 25,49 6 548,141 0,37 29,32 27,41 3 187,142 4020,063 0,37 0,36 XAF 40,93 41,19 39,89 40,97 45,06 45,07 CFA UGX SYP SDG 40,93 261,54 31,04 3,20 40,84 281,94 31,84 2,12 39,80 257,93 30,45 3,31 40,80 262,06 30,87 44,51 300,99 35,53 2,18 42,73 280,55 32,79 2,40 3,31 30 June 2019 Reviewed Rm Investment in joint venture Investments 452 592 Other current assets Cash and cash equivalents Total assets 54 1 102 8 1 094 1 237 Current liabilities Total liabilities Carrying amount of net assets sold Total disposal consideration - cash Transaction costs Gain on disposal Net cash Cash received Less: Cash and cash equivalents in Amadeus Less: Transaction costs paid Net cash received on sale (31) 112 1 237 (54) (31) 1 152 4/21/2020 MTN Group Limited Interim financial results for the six months ended 30 June 2019 - Notes to the condensed consolidated interim financial statements Network services Rm Mobile devices Rm Interconnect and roaming Rm Digital and Fintech Rm Six months ended 30 June REVENUE 2019 South Africa 4 333 1 053 2 519 2 345 896 820 196 197 2 769 1 543 777 449 1 143 510 1 177 453 259 13 528 18 716 8 572 4 384 2 128 2060 7 893 2 244 2 061 3 588 3 408 1 238 540 1 630 3 362 157 158 (3 362) 52 432 465 484 Nigeria SEAGHA Ghana Uganda Other SEAGHA WECA Ivory Coast Cameroon Other WECA MENA Syria Sudan Other MENA Major joint venture - Iran Head office companies and eliminations Hyperinflation impact Iran revenue exclusion Consolidated revenue 2018 South Africa Nigeria SEAGHA Ghana Uganda Other SEAGHA WECA Ivory Coast Cameroon Other WECA MENA Syria Sudan 20 227 237 261 (184) 51 (261) 7 212 33 (48) 4 630 (279) 6 062 3 672 1 250 1 074 2 265 13 891 14 128 6 856 3 612 1 548 1 696 6 953 2 244 1 478 1 736 818 466 163 189 1 267 679 319 1 331 982 511 1 867 273 563 2 842 3382 955 546 226 http://www.mtn-investor.com/reportina/interims-2019/fin-notes.html 4/21/2020 MTN Group Limited | Interim financial results for the six months ended 30 June 2019 - Notes to the condensed consolidated interim financial statements Other MENA 1 881 157 317 73 Major joint venture - Iran 5536 513 728 Head office companies and eliminations (17) (202) Hyperinflation impact Iran revenue exclusion (5 536) (513) (728) Consolidated revenue 45 242 4 087 5 735 5 73 49 (92) Revenue from contracts with customers Rm Other Six months ended 30 June REVENUE Interest revenue Rm Total revenue Rm Rm 752 209 232 22 185 22 232 12 664 343 2019 South Africa Nigeria SEAGHA Ghana Uganda Other SEAGHA WECA Ivory Coast 22 394 22 232 12 664 6 492 3 189 2 983 95 58 190 290 6 492 3 189 2 983 10 582 175 Cameroon Other WECA MENA 3 403 2 612 4567 4 104 10 582 3 403 2 612 4567 4 104 1 342 807 1955 3 999 311 218 (3 999) 72 296 1 342 807 1 955 Syria Sudan Other MENA Major joint venture - Iran Head office companies and eliminations Hyperinflation impact Iran revenue exclusion Consolidated revenue 49 309 4 012 311 218 (4 012) 72 505 (49) 1 960 (13) 209 4/21/2020 MTN Group Limited | Interim financial results for the six months ended 30 June 2019 - Notes to the condensed consolidated interim financial statements Financial year ended 31 December 2018 Audited Rm 15 660 16 574 7 865 4 452 1 980 854 1 433 2 314 4 133 457 reallocation of revenue from ICT internet services and bulk sms services, that previously formed part of other revenue, to network services. Six months Six months ended ended 30 June 30 June 2019 2018 Reviewed Reviewed Rm Rm CODM EBITDA South Africa 8 166 7 450 Nigeria 11 959 7 426 SEAGHA 5615 3 610 Ghana 3 217 2 166 Uganda 1 547 Other SEAGHA 851 590 WECA 2 986 Ivory Coast 996 934 Cameroon 778 Other WECA 1 212 923 MENA 1 262 1 246 Syria 525 351 Sudan 221 255 Other MENA 640 Head office companies and eliminations (30) CODM EBITDA 30 022 22016 Major joint venture - Iran 1 490 2 554 Hyperinflation impact 54 Gain on dilution of investment in associates and joint ventures 1 039 Gain on disposal of subsidiary 112 Tower sale profits CBN resolution Iran CODM EBITDA exclusion (1 490) (2 554) EBITDA before impairment of goodwill and joint venture 31 245 22 335 Depreciation, amortisation and impairment of goodwill and joint venture (15 995) (11 503) Net finance cost (7 088) (3 677) Net monetary gain 338 100 Share of results of associates and joint ventures after tax 197 Profit before tax 8 471 7 452 CAPITAL EXPENDITURE INCURRED 1 593 455 2 085 2 510 909 590 1 011 (727) 46 015 4 231 271 516 34 569 2 112 23 (744) (4 231) 48 246 (24 670) (8 331) 290 (527) 15 008 (29) 793 415 4/21/2020 MTN Group Limited | Interim financial results for the six months ended 30 June 2019 - Notes to the condensed consolidated interim financial statements South Africa 5 773 3 907 9 448 Nigeria 4 050 2 320 6 888 SEAGHA 3 574 2 219 3 801 Ghana 2 080 1 260 2015 Uganda 679 392 Other SEAGHA 815 567 993 WECA 1 218 2 351 3 281 Ivory Coast 257 562 1 364 Cameroon 101 694 Other WECA 546 1 688 1 223 MENA 646 2 215 Syria 332 935 Sudan 119 439 Other MENA 195 411 841 Major joint venture - Iran 861 1 622 3 716 Head office companies and eliminations 194 457 Hyperinflation impact (72) Iran CAPEX exclusion (861) (1 622) (3 716) 15 482 11 461 26 018 102 59 93 10. Net finance costs Six months ended 30 June 2019 Reviewed Rm Six months Financial ended year ended 30 June 31 December 2018 2018 Reviewed Audited Rm Rm 412 368 662 1 120 872 488 1 030 900 1992 Interest income on loans and receivables Interest income on bank deposits Finance income Interest expense on financial liabilities measured at amortised cost1 Net foreign exchange losses Finance costs Net finance costs recognised in profit or loss (7052) (1 066) (8 118) (7088) (3 977) (600) (4 577) (3677) (8 422) (1 901) (10 323) (8 331) 1 R189 million (June 2018: R396 million, December 2018: R812 million) relates to the discount unwind on the MTN Nigeria regulatory fine liability The adoption of IFRS 16 resulted in an increase in net finance costs of R2 688 million. 11. Share of results of associates and joint ventures after tax Six months ended 30 June 2019 Reviewed Rm (29) 177 (206) Six months ended 30 June 2018 Reviewed Rm Financial year ended 31 December 2018 Audited Rm MTN Iran Others 197 455 (258) (527) (281) (246) Earnings per ordinary share Number of ordinary shares As at 30 June 2019 Reviewed As at 30 June 2018 Reviewed As at 31 December 2018 Audited 1 798 004 650 1 797 848 603 1797 642 541 1797 642 541 1797 562 154 1797 602 678 Number of ordinary shares in issue At end of the period (excluding MTN Zakhele Futhi and treasury shares) Weighted average number of shares Add: Dilutive shares - Share options - MTN Zakhele Futhi - Share schemes Shares for dilutive earnings per share 22 268 043 5 183 236 1 825 299 882 30 195 952 22 966 591 1 547 709 3 870 043 1829 305 8151 824 439 312 Treasury shares Treasury shares of 9 430 246 (June: 9 791 839, December 2018: 9 791 839) are held by the group and 76 835 378 (June 2018: 76 835 378, December 2018: 76 835 378) are held by MTN Zakhele Futhi (RF) Limited (MTN Zakhele Futhi). Headline earnings Headline earnings is calculated in accordance with the circular titled Headline Earnings as issued by the South African Institute of Chartered Accountants as amended from time to time and as required by the JSE Limited. Six months ended 30 June 2019 Reviewed Rm Six months ended 30 June 2018 Reviewed Rm Financial year ended 31 December 2018 Audited Rm Basic headline earnings per share Reconciliation between profit attributable to the equity holders of the company and headline earnings Profit attributable to equity holders of the company Net (profit)/loss on disposal of property, plant and equipment and intangible assets - Subsidiaries (IAS 16) 4.433 4 381 8719 (7) (11) (11) 20 tohoto votor conocistiotori i soto bol A (24) (2 112) 312 4/21/2020 MTN Group Limited | Interim financial results for the six months ended 30 June 2019 - Notes to the condensed consolidated interim financial statements - Joint ventures (IAS 28) Profit on disposal of subsidiary (IFRS 10) (112) Impairment of investment in joint venture/goodwill (IAS 36) 191 149 Net impairment loss/(reversal) on property, plant and equipment and intangible assets (IAS 36) 59 (244) Net gain on dilution/sale of investment in joint venture/associate (IAS 28) (1 076) (438) - Subsidiaries (1 039) (304) - Joint ventures/associate (37) (134) Realisation of deferred gain on tower sale profit (12) Total tax effects of adjustments Total non-controlling interest effect of adjustments 27 42 Basic headline earnings 3 497 3 867 Earnings per share (cents) - Basic 247 244 - Basic headline 215 Diluted earnings per share (cents) - Diluted 243 - Diluted headline 192 211 (206) (703) (569) (134) (23) (18) 'S '**** 42 6 055 195 485 337 240 478 332 Reconciliation of level 3 financial assets The table below sets out the reconciliation of financial assets that are measured at fair value based on inputs that are not based on observable market data (level 3): Rm Balance at 1 January 2018 27 686 310 (8 030) 4 059 Acquisitions Loss on equity investment at fair value through other comprehensive income Foreign exchange differences Balance at 1 January 2019 Revaluation of equity investment at fair value through other comprehensive income Disposals Foreign exchange differences Balance at 30 June 2019 24 025 178 (606) (444) 23 153 Authorised commitments for the acquisition of property, plant, equipment and software As at As at 30 June 2019 Reviewed Rm 18 850 8 124 10 726 30 June 2018 Reviewed Rm As at 31 December 2018 Audited Rm 16 286 28 790 - Contracted - Not contracted 11 770 4 516 10 280 18 510 Interest-bearing liabilities As at 30 June 2019 Reviewed Rm As at As at 30 June 31 December 2018 2018 Reviewed Audited Rm Rm 299 Bank overdrafts Current borrowings 255 12 183 6 894 Current liabilities Non-current borrowings 7 193 83 091 103 13 437 13 540 78 855 92 395 12 438 72 563 85 001 90 284 16. Issue and repayment of debt During the period under review the following entities raised and repaid significant debt instruments: Six months ended 30 June 2018 Reviewed Six months ended 30 June 2019 Reviewed Rm Raised 9 550 4 500 2 800 Six months ended 30 June 2019 Reviewed Rm Repaid 7 950 3 800 3 000 Six months ended 30 June 2018 Reviewed Rm Raised 7 450 3 000 2 700 Financial year ended 31 Dec 2018 Audited Rm Rm Financial year ended 31 Dec 2018 Audited Rm Raised 11 750 3 500 6 500 MTN Holdings Repaid 2 157 500 1 350 Repaid 6320 563 5 450 2 250 1 150 1750 307 1750 307 Loan facilities General banking facilities Domestic medium-term programme MTN International (Mauritius) Limited Revolving credit facility MTN Nigeria Communications Plc Long-term borrowings Other 2 366 2 366 1 245 1245 3 753 3 753 8070 8 070 8 101 1753 1 753 7 887 7 887 2 271 19 708 3 228 3 228 2077 13 255 3628 3 628 1 251 14 695 4 770 4 770 4 946 25 219 2 138 946 8 101 4 868 27 359 7 293 17. Contingent liabilities As at 30 June 2019 Reviewed Rm As at As at 30 June 31 December 2018 2018 Reviewed Audited Rm Rm 2 127 2087 1 589 2 660 3716 4 747 Uncertain tax exposures Legal and regulatory matters 2 027 2 226 4 253 18. Exchange rates Six Six Six months months ended ended 30 June 30 June 2019 2018 Reviewed Reviewed Closing rates Financial year ended 31 Dec 2018 Audited Six months months ended ended 30 June 30 June 2019 2018 Reviewed Reviewed Average rates Financial year ended 31 Dec 2018 Audited USD 14,11 13,75 14,38 14,17 12,28 13,21 Foreign currency to South African rand: United States dollar South African rand to foreign currency: Nigerian naira Iranian rial Ghanaian cedi Cameroon Communaute Financire Africaine franc Cte d'Ivoire Communaute Financire Africaine franc Ugandan Shilling Syrian pound Sudanese pound NGN IRR GHS 25,56 7 972,001 0,38 26,25 25,33 3 089,102 6043,731 0,35 0,34 25,49 6 548,141 0,37 29,32 27,41 3 187,142 4020,063 0,37 0,36 XAF 40,93 41,19 39,89 40,97 45,06 45,07 CFA UGX SYP SDG 40,93 261,54 31,04 3,20 40,84 281,94 31,84 2,12 39,80 257,93 30,45 3,31 40,80 262,06 30,87 44,51 300,99 35,53 2,18 42,73 280,55 32,79 2,40 3,31 30 June 2019 Reviewed Rm Investment in joint venture Investments 452 592 Other current assets Cash and cash equivalents Total assets 54 1 102 8 1 094 1 237 Current liabilities Total liabilities Carrying amount of net assets sold Total disposal consideration - cash Transaction costs Gain on disposal Net cash Cash received Less: Cash and cash equivalents in Amadeus Less: Transaction costs paid Net cash received on sale (31) 112 1 237 (54) (31) 1 152
Step by Step Solution
There are 3 Steps involved in it

Get step-by-step solutions from verified subject matter experts


