Answered step by step
Verified Expert Solution
Question
1 Approved Answer
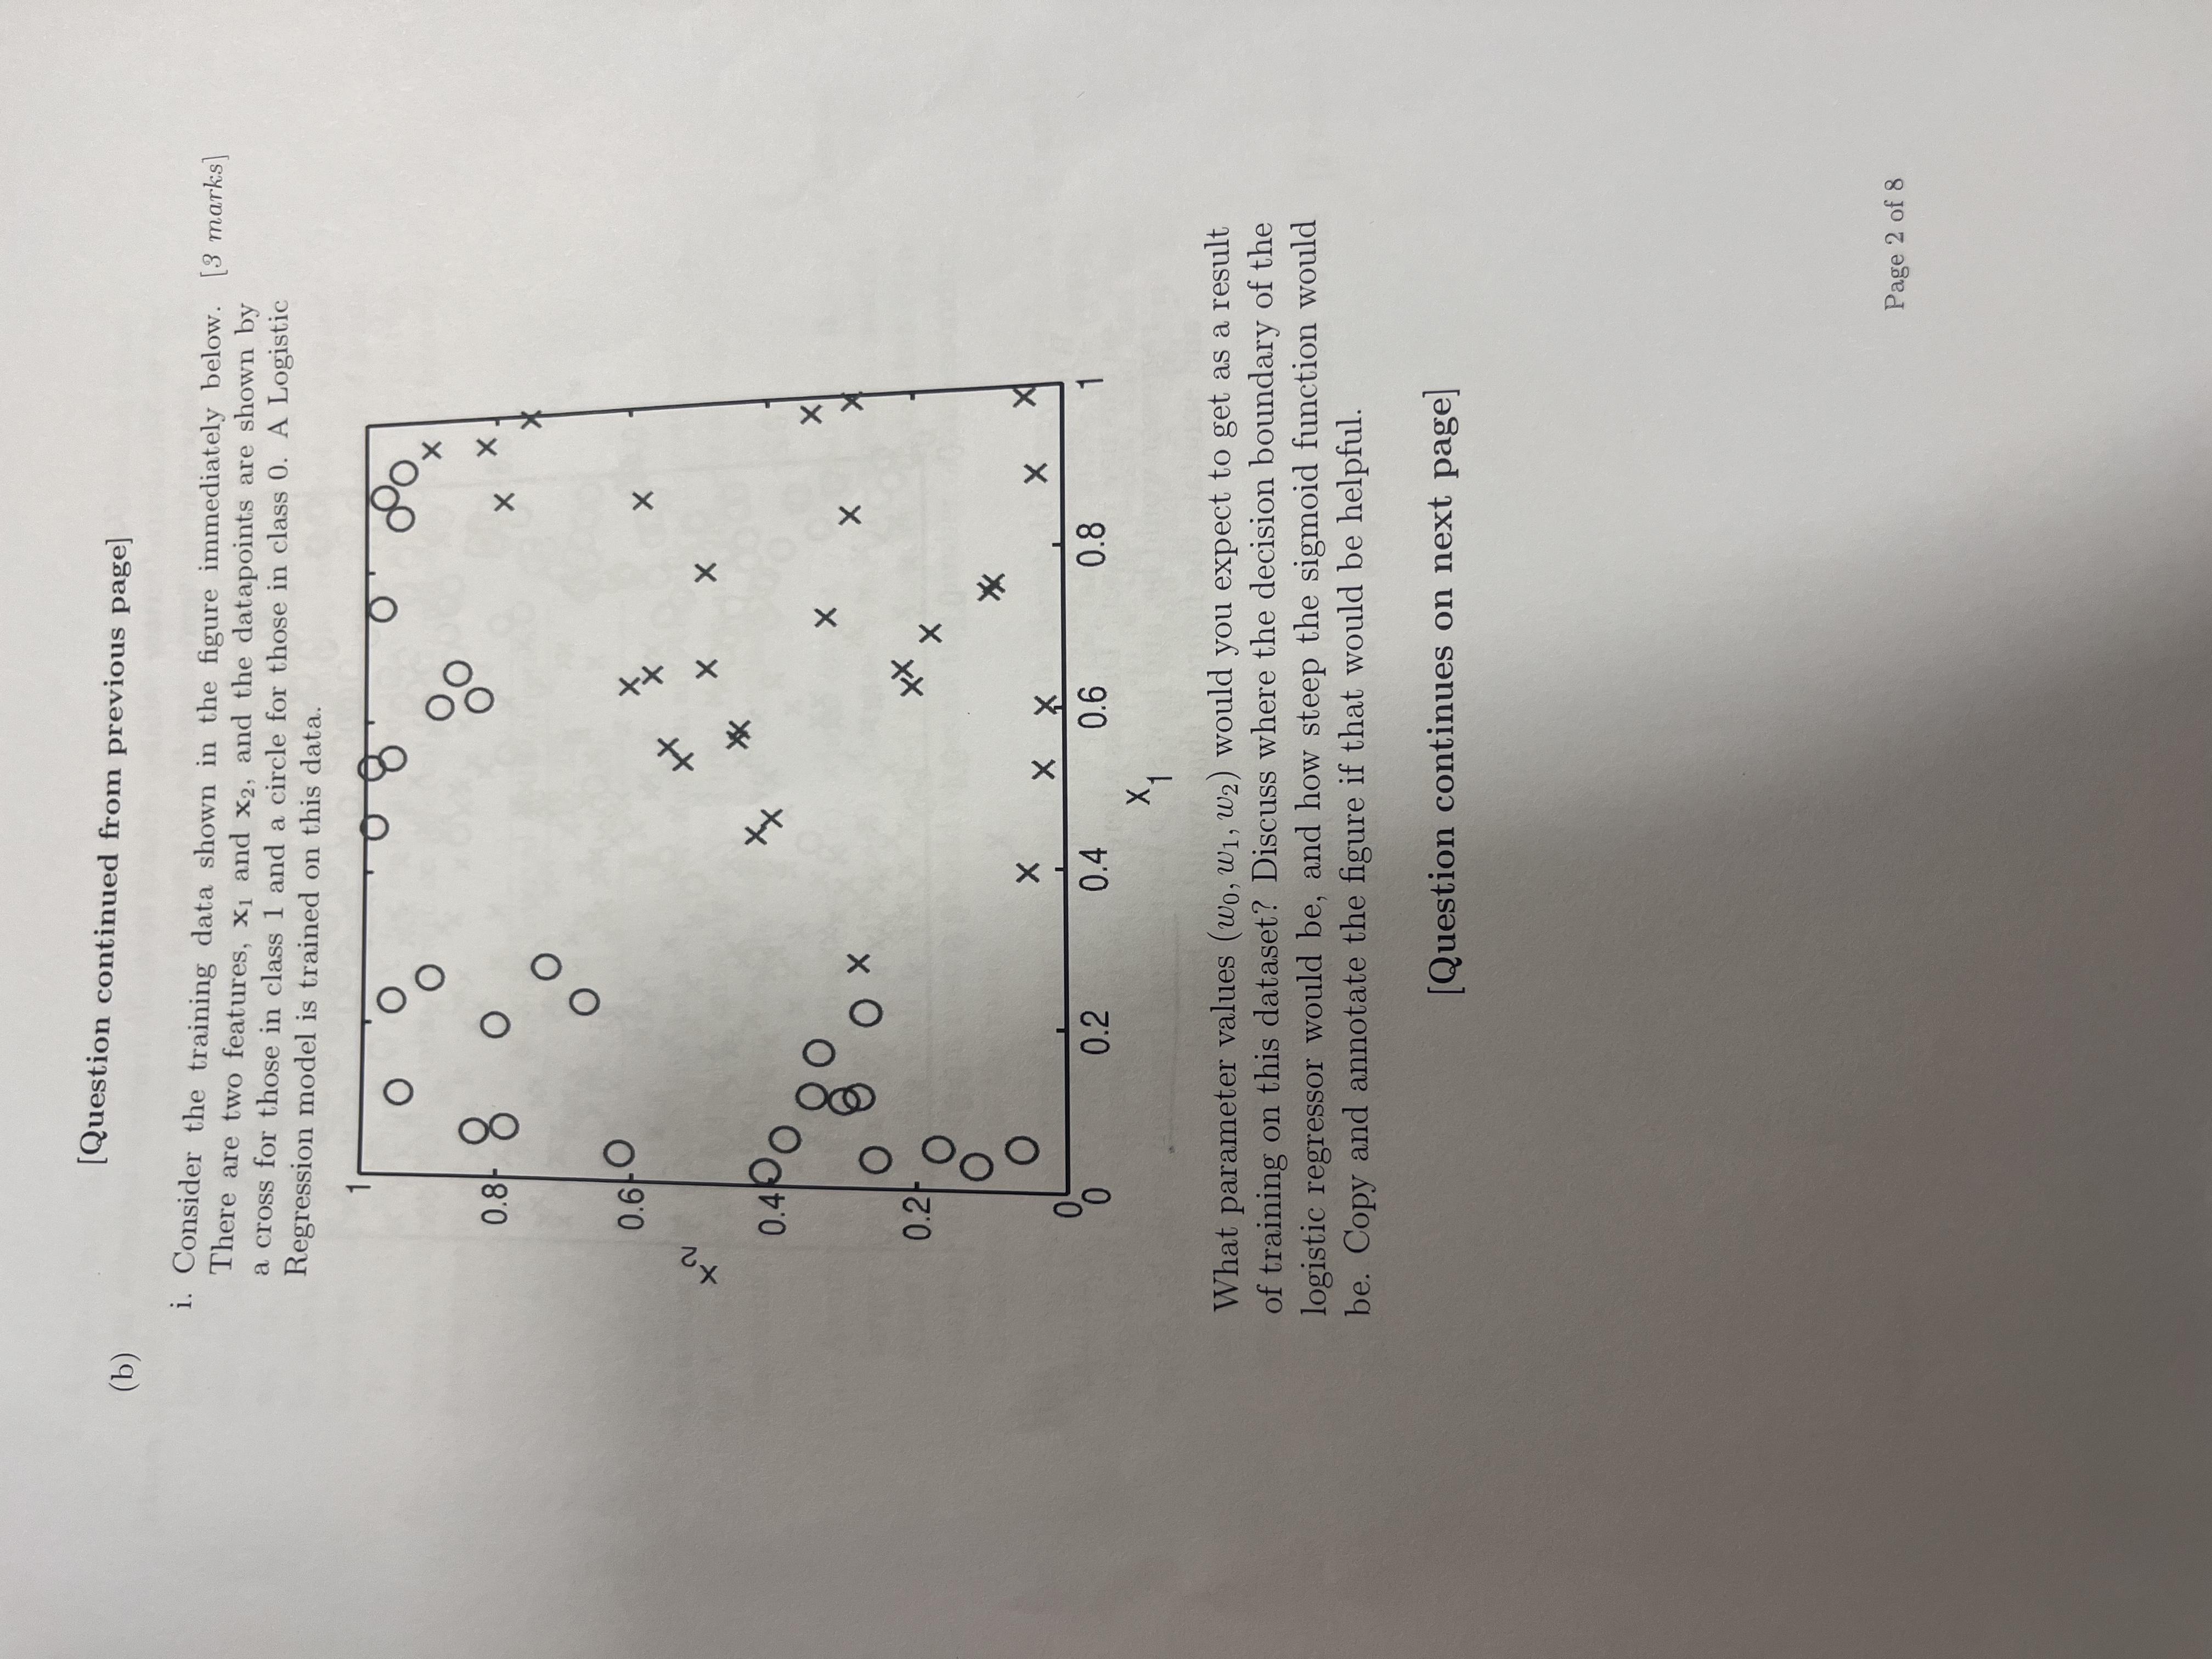
[ Question continued from previous page ] ( b ) i . Consider the training data shown in the figure immediately below. There are two
Question continued from previous page
b
i Consider the training data shown in the figure immediately below. There are two features, and and the datapoints are shown by
marks
a cross for those in class and a circle for those in class A Logistic Regression model is trained on this data.
What parameter values would you expect to get as a result of training on this dataset? Discuss where the decision boundary of the logistic regressor would be and how steep the sigmoid function would be Copy and annotate the figure if that would be helpful.
Question continues on next page
Page of

Step by Step Solution
There are 3 Steps involved in it
Step: 1

Get Instant Access to Expert-Tailored Solutions
See step-by-step solutions with expert insights and AI powered tools for academic success
Step: 2

Step: 3

Ace Your Homework with AI
Get the answers you need in no time with our AI-driven, step-by-step assistance
Get Started


