

Answered step by step
Verified Expert Solution
Question
1 Approved Answer
question F 4. Using the data for Johnson & Johnson (NYSE: IND), presented below: Fiscal Year Sales EBIT Interest Expense Total Net Income Earnings per
question F 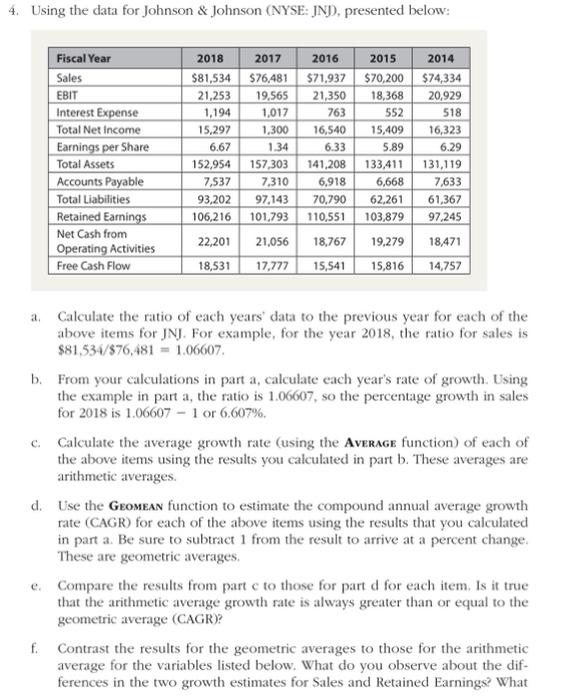
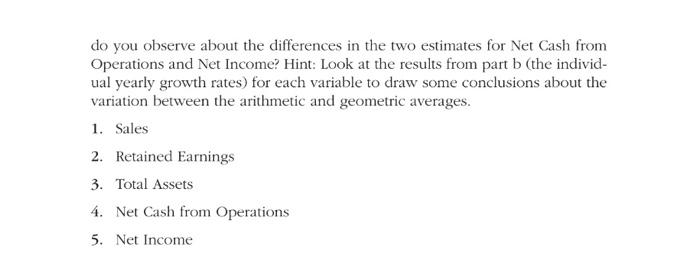
4. Using the data for Johnson & Johnson (NYSE: IND), presented below: Fiscal Year Sales EBIT Interest Expense Total Net Income Earnings per Share Total Assets Accounts Payable Total Liabilities Retained Earnings Net Cash from Operating Activities Free Cash Flow 2018 2017 2016 2015 2014 $81,534 $76,481 $71,937 $70,200 $74,334 21,253 19,565 21,350 18,368 20,929 1,194 1,017 763 552 518 15,297 1,300 16,540 15,409 16,323 6.67 1.34 6.33 5.89 6.29 152,954 157,303 141,208 133,411 131,119 7,537 7,310 6,918 6,668 7,633 93,202 97,143 70,790 62,261 61,367 106,216 101.793 110,551 103,879 97,245 22,201 21,056 18,767 19.279 18,471 18,531 17,777 15,541 15,816 14,757 C. a. Calculate the ratio of each years' data to the previous year for each of the above items for JNJ. For example, for the year 2018, the ratio for sales is $81,534/576,481 = 1.06607 b. From your calculations in part a, calculate each year's rate of growth. Using the example in part a, the ratio is 1.06607, so the percentage growth in sales for 2018 is 1.06607 - 1 or 6.607%. Calculate the average growth rate (using the Average function of each of the above items using the results you calculated in part b. These averages are arithmetic averages d. Use the Geomean function to estimate the compound annual average growth rate (CAGR for each of the above items using the results that you calculated in part a. Be sure to subtract 1 from the result to arrive at a percent change. These are geometric averages e. Compare the results from partc to those for part d for each item. Is it true that the arithmetic average growth rate is always greater than or equal to the geometric average (CAGR)? f. Contrast the results for the geometric averages to those for the arithmetic average for the variables listed below. What do you observe about the dif- ferences in the two growth estimates for Sales and Retained Earnings? What do you observe about the differences in the two estimates for Net Cash from Operations and Net Income? Hint: Look at the results from part b (the individ- ual yearly growth rates) for each variable to draw some conclusions about the variation between the arithmetic and geometric averages. 1. Sales 2. Retained Earnings 3. Total Assets 4. Net Cash from Operations 5. Net Income Step by Step Solution
There are 3 Steps involved in it
Step: 1

Get Instant Access to Expert-Tailored Solutions
See step-by-step solutions with expert insights and AI powered tools for academic success
Step: 2

Step: 3
Ace Your Homework with AI
Get the answers you need in no time with our AI-driven, step-by-step assistance
Get Started
Communication Audit In Globally Integrated R And D Project Teams
Authors: Justyna Alnajjar
1st Edition
3631666608, 978-3631666609