question of sql query/database, all schemas needed are as below
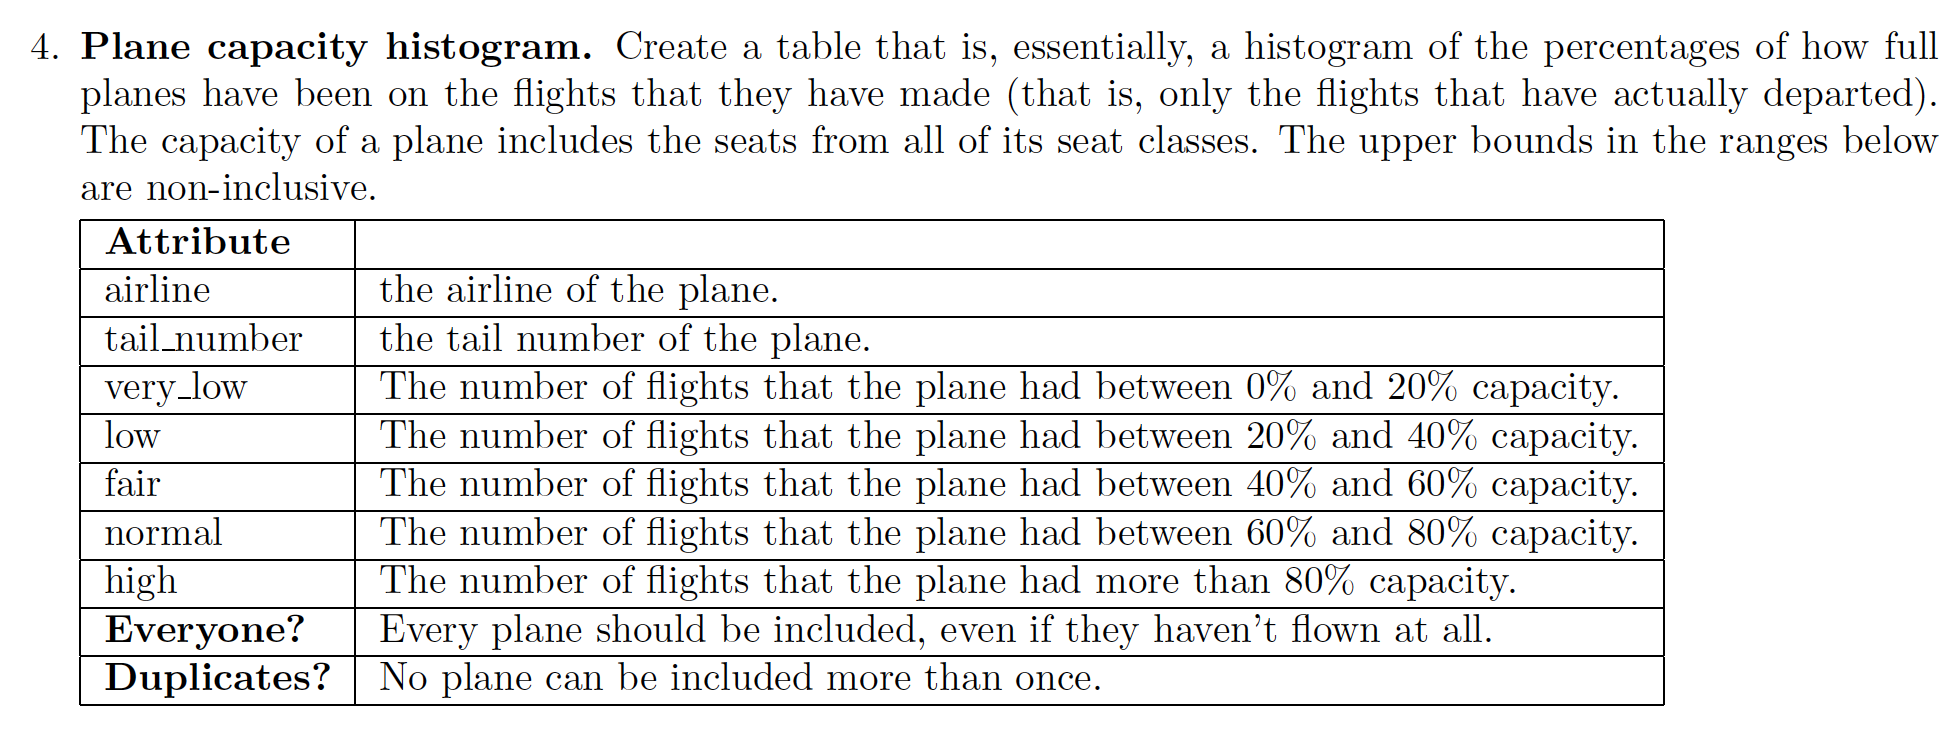
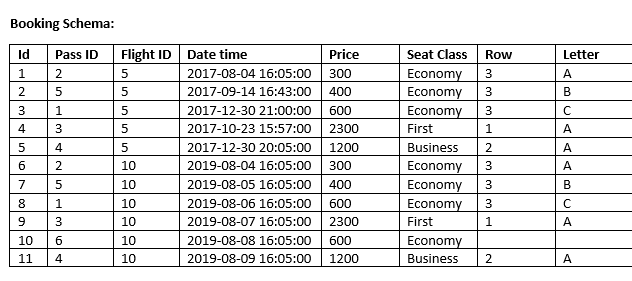
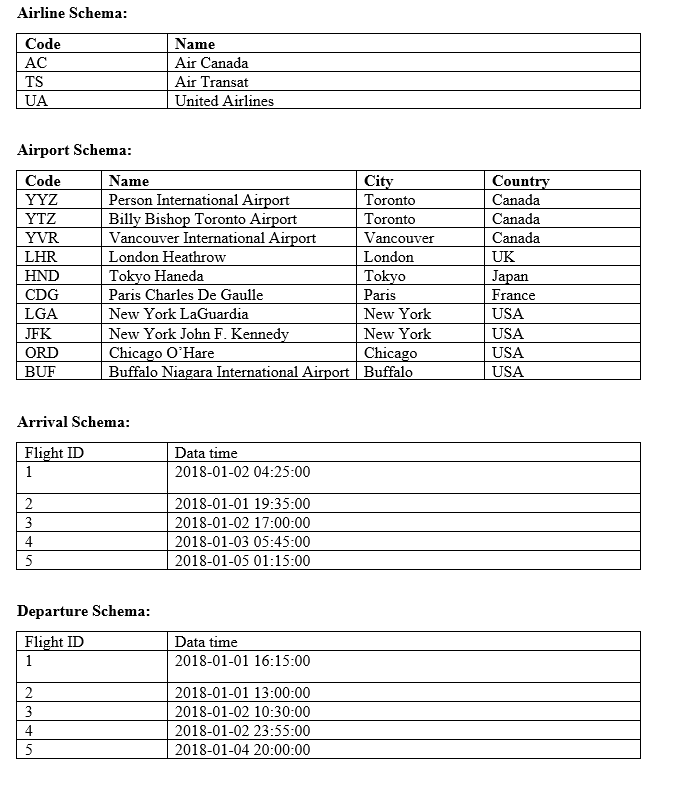
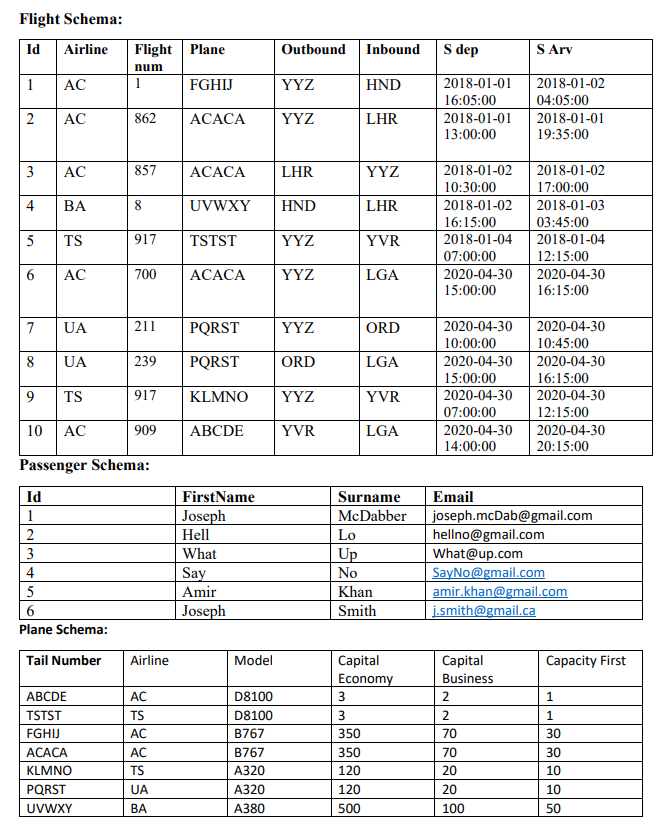
4. Plane capacity histogram. Create a table that is, essentially, a histogram of the percentages of how full planes have been on the flights that they have made (that is, only the flights that have actually departed). The capacity of a plane includes the seats from all of its seat classes. The upper bounds in the ranges below are non-inclusive. Attribute airline the airline of the plane. tail number the tail number of the plane. very_low The number of flights that the plane had between 0% and 20% capacity. low The number of flights that the plane had between 20% and 40% capacity. fair The number of flights that the plane had between 40% and 60% capacity. normal The number of flights that the plane had between 60% and 80% capacity. high The number of flights that the plane had more than 80% capacity. Everyone? Every plane should be included, even if they haven't flown at all. Duplicates? No plane can be included more than once. Booking Schema: Id Seat Class 1 2 Pass ID 2 5 Flight ID 5 5 Row 3 3 Letter A B 1 3 5 5 3 1 A CoaWN 4 Date time 2017-08-04 16:05:00 2017-09-14 16:43:00 2017-12-30 21:00:00 2017-10-23 15:57:00 2017-12-30 20:05:00 2019-08-04 16:05:00 2019-08-05 16:05:00 2019-08-06 16:05:00 2019-08-07 16:05:00 2019-08-08 16:05:00 2019-08-09 16:05:00 5 10 10 Price 300 400 600 2300 1200 300 400 600 2300 600 1200 2 5 Economy Economy Economy First Business Economy Economy Economy First Economy Business 2 3 A A B 3 1 | 10 10 3 1 C A 9 3 10 11 6 4 10 10 2 A Airline Schema: Code AC TS UA Name Air Canada Air Transat United Airlines Airport Schema: Code YYZ YTZ YVR LHR HND CDG LGA JFK ORD BUF Name City Person International Airport Toronto Billy Bishop Toronto Airport Toronto Vancouver International Airport Vancouver London Heathrow London Tokyo Haneda Tokyo Paris Charles De Gaulle Paris New York LaGuardia New York New York John F. Kennedy New York Chicago O'Hare Chicago Buffalo Niagara International Airport Buffalo Country Canada Canada Canada UK Japan France USA USA USA USA Arrival Schema: Flight ID 1 Data time 2018-01-02 04:25:00 2 3 4 5 2018-01-01 19:35:00 2018-01-02 17:00:00 2018-01-03 05:45:00 2018-01-05 01:15:00 Departure Schema: Flight ID 1 Data time 2018-01-01 16:15:00 2 3 2018-01-01 13:00:00 2018-01-02 10:30:00 2018-01-02 23:55:00 2018-01-04 20:00:00 5 Flight Schema: Id Airline Outbound Inbound S dep S Arv Flight Plane num 1 FGHIJ 1 AC YYZ HND 2018-01-01 16:05:00 2018-01-01 13:00:00 2018-01-02 04:05:00 2018-01-01 19:35:00 2 AC 862 ACACA YYZ LHR 3 AC 857 ACACA LHR YYZ 4 BA 8 UVWXY HND LHR 2018-01-02 10:30:00 2018-01-02 16:15:00 2018-01-04 07:00:00 2020-04-30 15:00:00 2018-01-02 17:00:00 2018-01-03 03:45:00 2018-01-04 12:15:00 2020-04-30 16:15:00 5 TS 917 TSTST YYZ YVR AC 700 ACACA YYZ LGA 7 UA 211 PQRST YYZ ORD 8 UA 239 PQRST ORD LGA 2020-04-30 10:00:00 2020-04-30 15:00:00 2020-04-30 07:00:00 2020-04-30 14:00:00 2020-04-30 10:45:00 2020-04-30 16:15:00 2020-04-30 12:15:00 2020-04-30 20:15:00 9 TS 917 KLMNO YYZ YVR 10 AC 909 ABCDE YVR LGA Passenger Schema: Id 1 2 3 4 5 6 Plane Schema: FirstName Joseph Hell What Say Amir Joseph Surname McDabber Lo Up No Khan Smith Email joseph.mcDab@gmail.com hellno@gmail.com What@up.com SayNo@gmail.com amir.khan@gmail.com j.smith@gmail.ca Tail Number Airline Model Capacity First Capital Business 2 1 ABCDE TSTST FGHIJ ACACA KLMNO PQRST UVWXY 2 70 AC TS AC AC TS UA Capital Economy 3 3 350 350 120 120 500 D8100 D8100 B767 B767 A320 A320 A380 70 20 20 1 30 30 10 10 BA 100 50 4. Plane capacity histogram. Create a table that is, essentially, a histogram of the percentages of how full planes have been on the flights that they have made (that is, only the flights that have actually departed). The capacity of a plane includes the seats from all of its seat classes. The upper bounds in the ranges below are non-inclusive. Attribute airline the airline of the plane. tail number the tail number of the plane. very_low The number of flights that the plane had between 0% and 20% capacity. low The number of flights that the plane had between 20% and 40% capacity. fair The number of flights that the plane had between 40% and 60% capacity. normal The number of flights that the plane had between 60% and 80% capacity. high The number of flights that the plane had more than 80% capacity. Everyone? Every plane should be included, even if they haven't flown at all. Duplicates? No plane can be included more than once. Booking Schema: Id Seat Class 1 2 Pass ID 2 5 Flight ID 5 5 Row 3 3 Letter A B 1 3 5 5 3 1 A CoaWN 4 Date time 2017-08-04 16:05:00 2017-09-14 16:43:00 2017-12-30 21:00:00 2017-10-23 15:57:00 2017-12-30 20:05:00 2019-08-04 16:05:00 2019-08-05 16:05:00 2019-08-06 16:05:00 2019-08-07 16:05:00 2019-08-08 16:05:00 2019-08-09 16:05:00 5 10 10 Price 300 400 600 2300 1200 300 400 600 2300 600 1200 2 5 Economy Economy Economy First Business Economy Economy Economy First Economy Business 2 3 A A B 3 1 | 10 10 3 1 C A 9 3 10 11 6 4 10 10 2 A Airline Schema: Code AC TS UA Name Air Canada Air Transat United Airlines Airport Schema: Code YYZ YTZ YVR LHR HND CDG LGA JFK ORD BUF Name City Person International Airport Toronto Billy Bishop Toronto Airport Toronto Vancouver International Airport Vancouver London Heathrow London Tokyo Haneda Tokyo Paris Charles De Gaulle Paris New York LaGuardia New York New York John F. Kennedy New York Chicago O'Hare Chicago Buffalo Niagara International Airport Buffalo Country Canada Canada Canada UK Japan France USA USA USA USA Arrival Schema: Flight ID 1 Data time 2018-01-02 04:25:00 2 3 4 5 2018-01-01 19:35:00 2018-01-02 17:00:00 2018-01-03 05:45:00 2018-01-05 01:15:00 Departure Schema: Flight ID 1 Data time 2018-01-01 16:15:00 2 3 2018-01-01 13:00:00 2018-01-02 10:30:00 2018-01-02 23:55:00 2018-01-04 20:00:00 5 Flight Schema: Id Airline Outbound Inbound S dep S Arv Flight Plane num 1 FGHIJ 1 AC YYZ HND 2018-01-01 16:05:00 2018-01-01 13:00:00 2018-01-02 04:05:00 2018-01-01 19:35:00 2 AC 862 ACACA YYZ LHR 3 AC 857 ACACA LHR YYZ 4 BA 8 UVWXY HND LHR 2018-01-02 10:30:00 2018-01-02 16:15:00 2018-01-04 07:00:00 2020-04-30 15:00:00 2018-01-02 17:00:00 2018-01-03 03:45:00 2018-01-04 12:15:00 2020-04-30 16:15:00 5 TS 917 TSTST YYZ YVR AC 700 ACACA YYZ LGA 7 UA 211 PQRST YYZ ORD 8 UA 239 PQRST ORD LGA 2020-04-30 10:00:00 2020-04-30 15:00:00 2020-04-30 07:00:00 2020-04-30 14:00:00 2020-04-30 10:45:00 2020-04-30 16:15:00 2020-04-30 12:15:00 2020-04-30 20:15:00 9 TS 917 KLMNO YYZ YVR 10 AC 909 ABCDE YVR LGA Passenger Schema: Id 1 2 3 4 5 6 Plane Schema: FirstName Joseph Hell What Say Amir Joseph Surname McDabber Lo Up No Khan Smith Email joseph.mcDab@gmail.com hellno@gmail.com What@up.com SayNo@gmail.com amir.khan@gmail.com j.smith@gmail.ca Tail Number Airline Model Capacity First Capital Business 2 1 ABCDE TSTST FGHIJ ACACA KLMNO PQRST UVWXY 2 70 AC TS AC AC TS UA Capital Economy 3 3 350 350 120 120 500 D8100 D8100 B767 B767 A320 A320 A380 70 20 20 1 30 30 10 10 BA 100 50