QUESTION: Part (c) will be posted in the comments
( Its a answer first, see next question after)
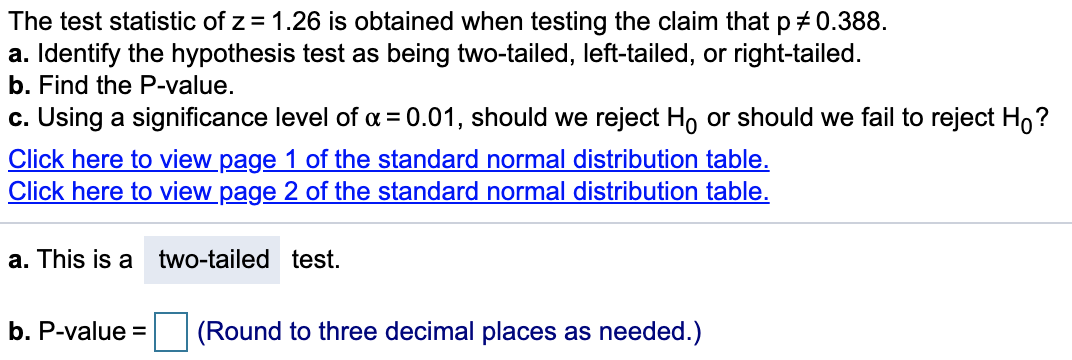
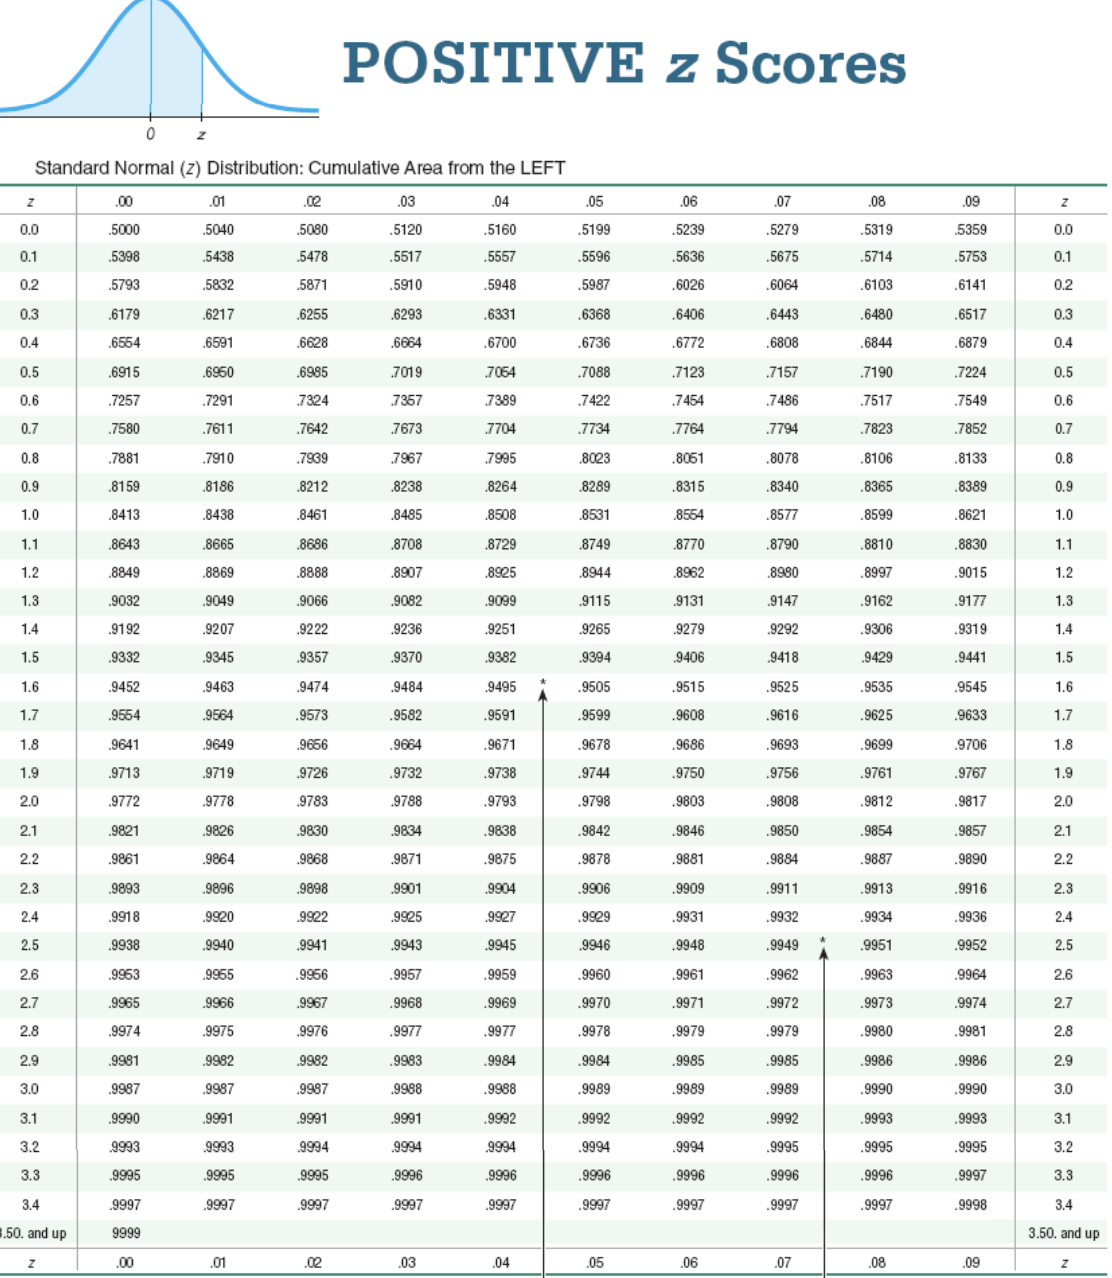
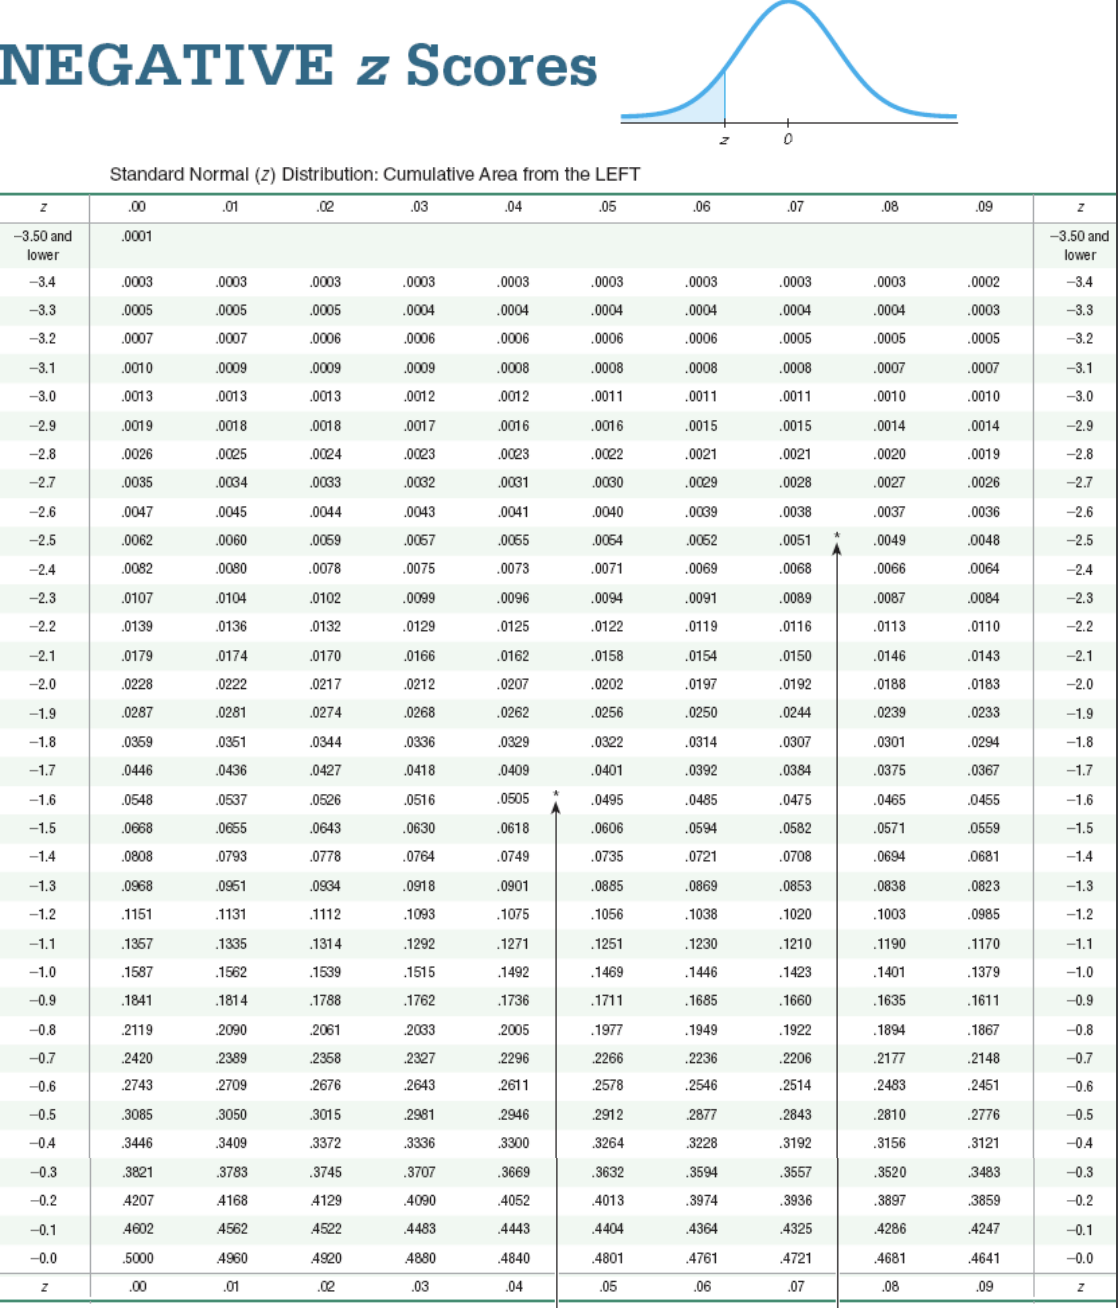
The test statistic of z = 1.26 is obtained when testing the claim that p a5 0.388. a. Identify the hypothesis test as being two-tailed, left-tailed, or right-tailed. b. Find the Pvalue. 6. Using a signicance level of or = 0.01, should we reject H0 or should we fail to reject H0? Click here to View [age 1 of the standard normal distribution table. Click here to View page 2 of the standard normal distribution table. a. This isa two-tailed test. b. P-value = D (Round to three decimal places as needed.) POSITIVE z Scores Standard Normal (z) Distribution: Cumulative Area from the LEFT 03 05 06 07 .08 09 5040 5080 5199 0.0 0.1 5398 .5438 5478 5517 5557 5596 5675 5714 5753 D.1 0.2 .5793 .5832 5871 .5910 .5948 .5987 6026 6064 .6103 .6141 0.2 0.3 6179 6217 6255 6293 6331 6368 ;406 .6517 0.3 0.4 6915 7123 0.6 ,7257 7291 .7324 7357 .7389 .7422 .7454 .7486 .7517 .7549 7580 .7611 7642 7673 7704 7734 7764 .7794 7823 .7852 0.8 .7881 .7910 .7939 .7967 7995 8023 8061 .8078 8106 .8133 0.8 .8159 8186 212 3238 8264 8289 8315 .8340 .8365 .8389 0.9 8413 .8438 8461 8508 8531 8599 .8621 1.0 1.1 8849 .8869 8888 .8907 8925 .8944 8962 8980 8997 .9015 1.2 1.3 9032 9049 9066 9082 .9099 9115 9131 9147 9162 9177 1.3 .9192 9207 .9222 9236 9251 9265 279 9292 .9306 .9319 1.4 1.5 9332 9345 9357 9370 .9441 1.5 1.6 .9452 9495 .9505 515 .9525 .9535 .9545 1.6 1.7 1.9 .9713 9719 9732 .9744 9750 1.9 2.0 .9772 9778 9783 .9788 .9793 9798 9803 .9808 9812 .9817 2.0 2.1 .9821 9826 9830 9834 .9838 .9842 9846 .9850 9854 .9857 2.1 2.2 9861 9864 .9868 9871 .9875 9878 9887 .9890 2.2 .9893 9896 .9898 9901 .9904 .9906 9909 9911 .9913 .9916 2.3 9918 .9938 .9940 .9941 .9943 .9945 .9946 9948 .9949 .9951 .9952 2.5 .9963 .9955 9956 .9957 .9959 9960 9961 .9962 2.7 .9965 .9966 9967 9968 9969 9970 9971 .9972 .9973 .9974 2.7 2.8 .9974 .9975 .9976 9977 .9977 9978 9979 9979 .9981 2.8 2.9 .9981 9982 9982 9983 .9984 9984 1985 9985 .9986 .9986 2.9 .9987 .9989 9989 .9990 .9990 3.0 9990 .9991 9991 9993 3.1 .9995 9995 9995 9996 9996 9996 .9996 .9997 34 9997 .9997 .9997 .9997 .9997 .9997 9997 .9997 .9997 9998 .50. and up 9999 .01 .02 .03 .04 05 06 07 .08 09NEGATIVE z Scores Standard Normal (z) Distribution: Cumulative Area from the LEFT 05 .06 07 08 .09 -3.50 and 0001 3.50 and lower .0003 0003 .0003 .0003 .0003 0003 0003 0003 0003 0002 -3.4 -3.3 0005 1005 .0004 0004 0004 .0004 0003 -3.3 -3.2 -3.2 .0005 .0005 .0005 0007 .0012 .0026 .0024 0019 .0033 .0032 .0031 .0030 .0029 .0028 .0027 0026 -2.6 .0047 .0045 .0044 .0043 .0041 .0040 .0039 .0038 .0037 0036 -2.6 .0062 .0059 .0065 .0064 .0062 .0051 0049 .0048 -2. -2.4 .0082 0078 .0075 .0073 . 0071 .0069 .0068 0066 .0064 -24 0107 .0104 .0102 .0099 .0096 . 0094 .0091 .0089 .0087 .0084 -2.3 -2.2 .0139 .0132 0129 .0125 .0122 .0119 .0116 .0113 0110 -2.2 .0179 .0174 0170 .0166 .0162 . 0158 . 0154 .0150 0146 0143 -2.0 .0228 0217 .0212 0207 .0202 0197 .0192 .0188 0183 -2.0 .0287 .0262 . 0256 . 0239 .0233 -1.8 .0359 0351 .0344 .0336 0329 .0314 0307 .0301 0294 -1.8 .0526 .0516 . 0505 .0495 .0475 .0455 -1.6 .0643 . 0606 .0594 0559 0778 .0764 .0749 .0735 .0721 .0708 .0694 .0681 -1.4 .0968 .0961 .0934 0918 .0901 .0869 .0853 0838 -1.2 .1151 .1131 1112 .1093 . 1075 . 1056 . 1038 .1020 1003 .0985 -1.2 .1357 1314 .1292 .1271 . 1251 . 1230 . 1210 1190 .1170 .1587 .1539 .1515 .1492 .1469 1446 .1423 1401 . 1379 -1.0 -0.9 1841 .1814 1788 .1762 .1736 .1711 . 1685 . 1660 . 1635 1611 -0.9 -0.8 2119 .2090 .2061 .2033 .2005 .1977 1949 .1922 1894 1867 -0.8 2420 2358 2296 2266 2236 .2206 2177 2148 -0.7 -0.7 .2743 2676 2611 2776 .3446 .3409 3372 .3336 .3300 .3264 .3228 .3192 .3156 .3121 .3821 3783 3707 .3669 .3594 .3557 .3520 3483 -0.2 4207 4168 4129 4090 4052 .4013 .3974 .3936 3897 3859 -0.2 4602 4562 4522 4483 4443 .4404 4364 4325 4286 4247 -0.0 5000 4960 4920 4880 .4840 4801 4761 4721 4681 4641 -0.0 .00 .01 .02 .03 .04 .05 .06 .07 .08 .09


