

Question
Question: Ratio Analysis: What trends do you see looking at your profitability ratios? What is causing this trend? Are the sharks likely to challenge these
Question:
Ratio Analysis: What trends do you see looking at your profitability ratios? What is causing this trend? Are the sharks likely to challenge these figures?
(The Sharks gave you the $1,000,000 in funding you asked for in exchange for 25% ownership of your companys profits. You issued 26,000 $1-par shares to the Sharks and updated your additional paid-in capital by the excess received. The sharks have a 9% Required Rate of Return on their investment)
Financial Statements and Ratios are included below to answer this question.
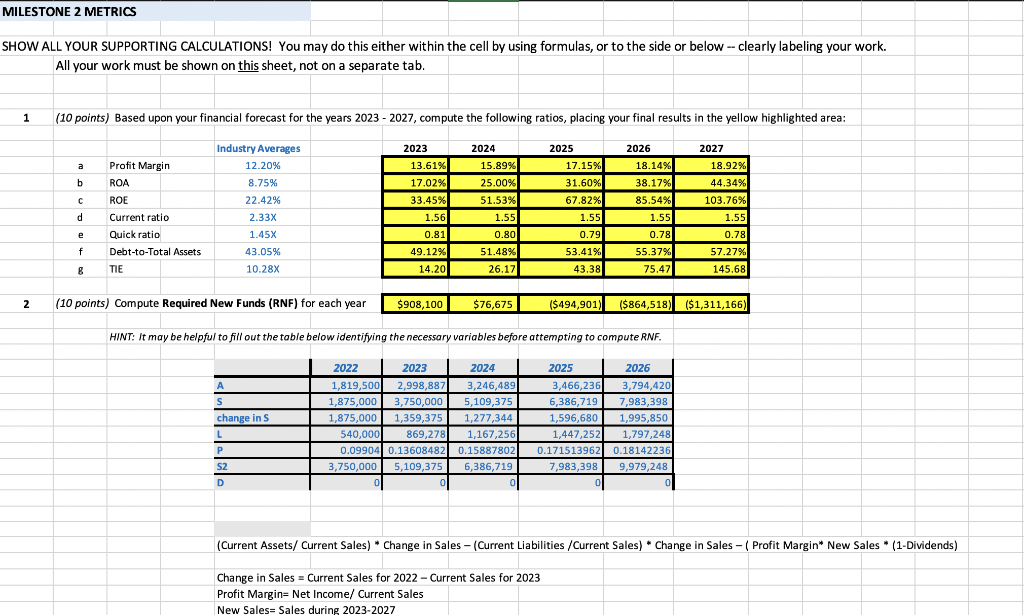
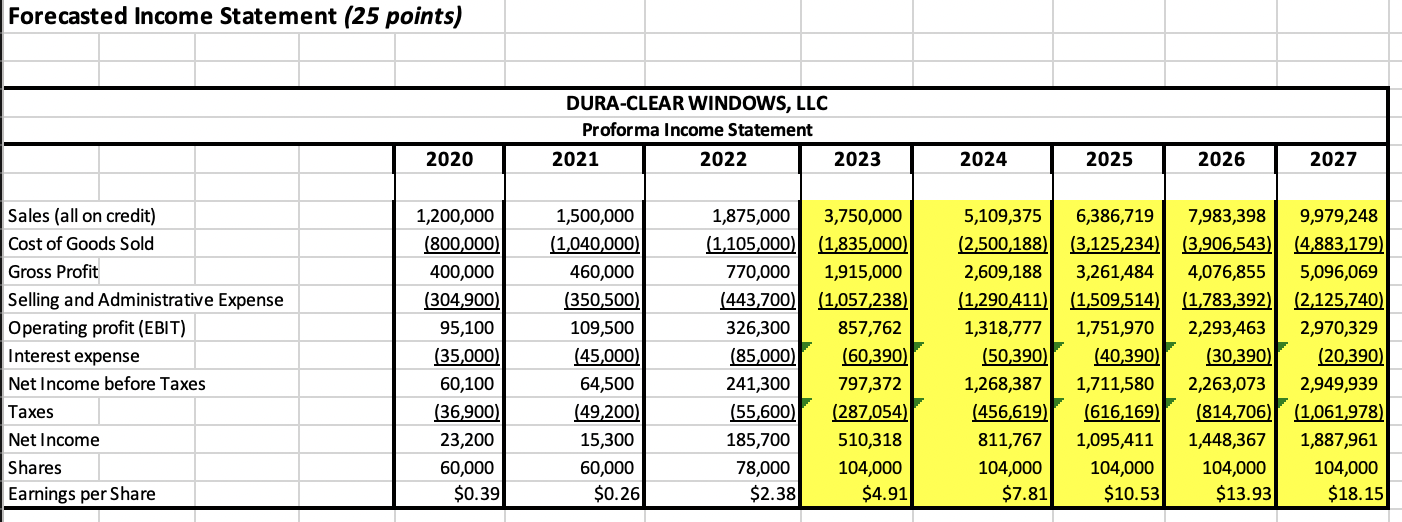
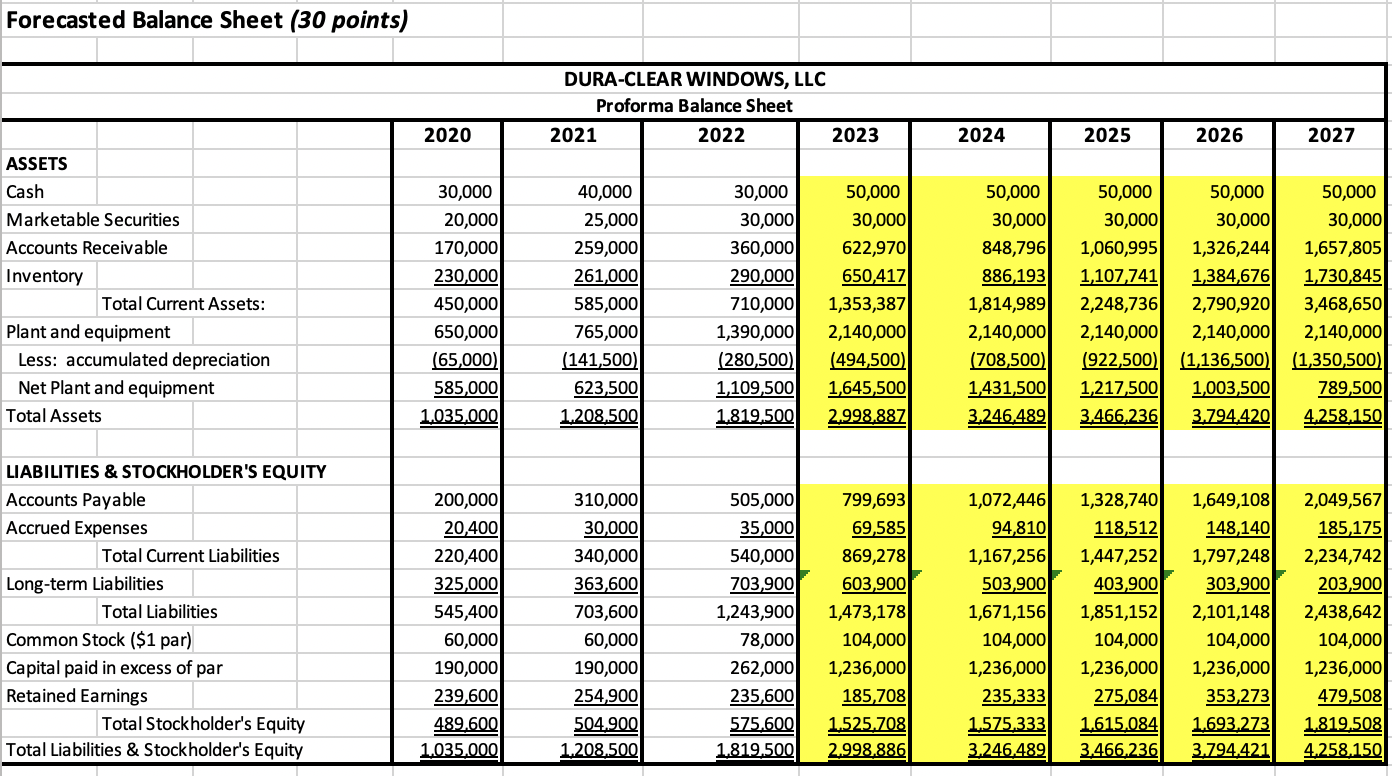
MILESTONE 2 METRICS SHOW ALL YOUR SUPPORTING CALCULATIONS! You may do this either within the cell by using formulas, or to the side or below - clearly labeling your work. All your work must be shown on this sheet, not on a separate tab. 1 (10 points) Based upon your financial forecast for the years 20232027, compute the following ratios, placing your final results in the yellow highlighted area: HINT: It may be helpful to fill out the table below identifying the necessary variables before attempting to compute RNF. \begin{tabular}{l|r|r|r|r|r|} & \multicolumn{1}{|c|}{ 2022 } & \multicolumn{1}{c|}{ 2023 } & \multicolumn{1}{c|}{2024} & \multicolumn{1}{c|}{2025} & \multicolumn{1}{c|}{2026} \\ \hline A & 1,819,500 & 2,998,887 & 3,246,489 & 3,466,236 & 3,794,420 \\ \hline S & 1,875,000 & 3,750,000 & 5,109,375 & 6,386,719 & 7,983,398 \\ \hline change in S & 1,875,000 & 1,359,375 & 1,277,344 & 1,596,680 & 1,995,850 \\ \hline L & 540,000 & 869,278 & 1,167,256 & 1,447,252 & 1,797,248 \\ \hline P & 0.09904 & 0.13608482 & 0.15887802 & 0.171513962 & 0.18142236 \\ \hline S2 & 3,750,000 & 5,109,375 & 6,386,719 & 7,983,398 & 9,979,248 \\ \hline D & 0 & 0 & 0 & 0 & 0 \end{tabular} (Current Assets/ Current Sales) * Change in Sales - (Current Liabilities /Current Sales) * Change in Sales - ( Profit Margin* New Sales * (1-Dividends) Change in Sales = Current Sales for 2022 - Current Sales for 2023 Profit Margin= Net Income/ Current Sales New Sales= Sales during 2023-2027 Forecasted Income Statement (25 points) DURA-CLEAR WINDOWS, LLC Proforma Income Statement Forecasted Balance Sheet ( 30 points)
Step by Step Solution
There are 3 Steps involved in it
Step: 1

Get Instant Access to Expert-Tailored Solutions
See step-by-step solutions with expert insights and AI powered tools for academic success
Step: 2

Step: 3
Ace Your Homework with AI
Get the answers you need in no time with our AI-driven, step-by-step assistance
Get Started
Hospitality Financial Accounting
Authors: Jerry J. Weygandt, Donald E. Kieso, Paul D. Kimmel, Agnes L.
2nd Edition
9780470598092, 470083603, 978-0470083604