

Question
Question: Recall that Note 3 says the company depreciates its buildings and roof over a useful life of between 20 and 50 years. Using the
Question:
Recall that Note 3 says the company depreciates its buildings and roof over a useful life of between 20 and 50 years. Using the table determine the AVERAGE cost of the Buildings over the fiscal year ending Feb 2, 2020. [Add together the beginning of the year cost value, and the end of the year cost value, and divide by 2]. Then divide this average cost by the fiscal 2020 depreciation expense for buildings, which is found on the table in the same column. How would you interpret the result (which is measured in the number of years)? Does your calculation fall within the range of 20 to 50 years?
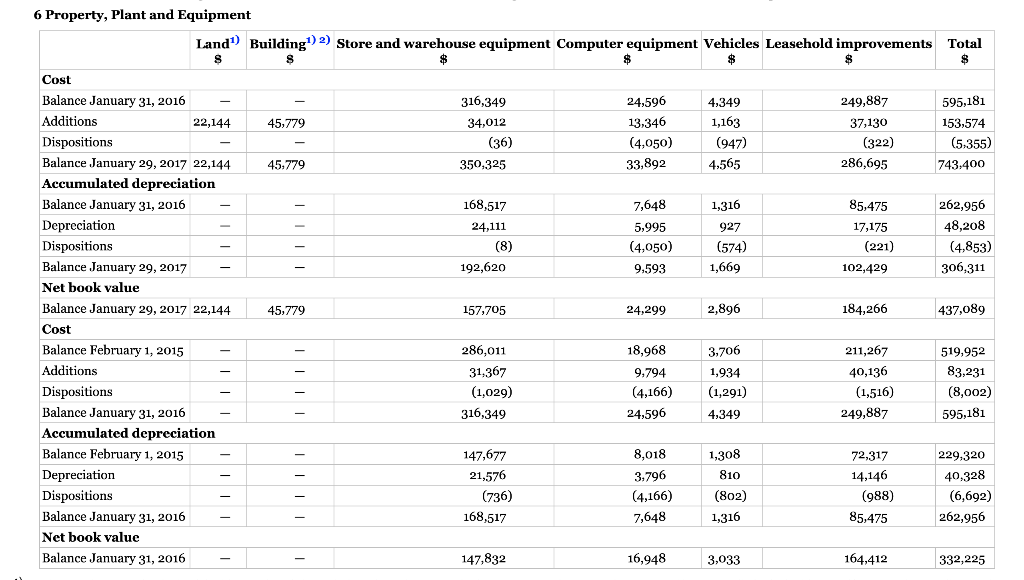
1) Total costs of $67,923 for the land, building and roof also include racking, fixtures and other equipment that are in the process of being installed. The building itself is now substantially complete.
2) Recognized costs of $33,295 for the building and roof will start being depreciated as at January 30, 2017, which is when management deemed the building to be substantially available for use. Racking, fixtures and other equipment (including hardware and software) totalling $12,484 will be reclassified to store and warehouse equipment, computer equipment and computer software at a later date, once depreciation begins.
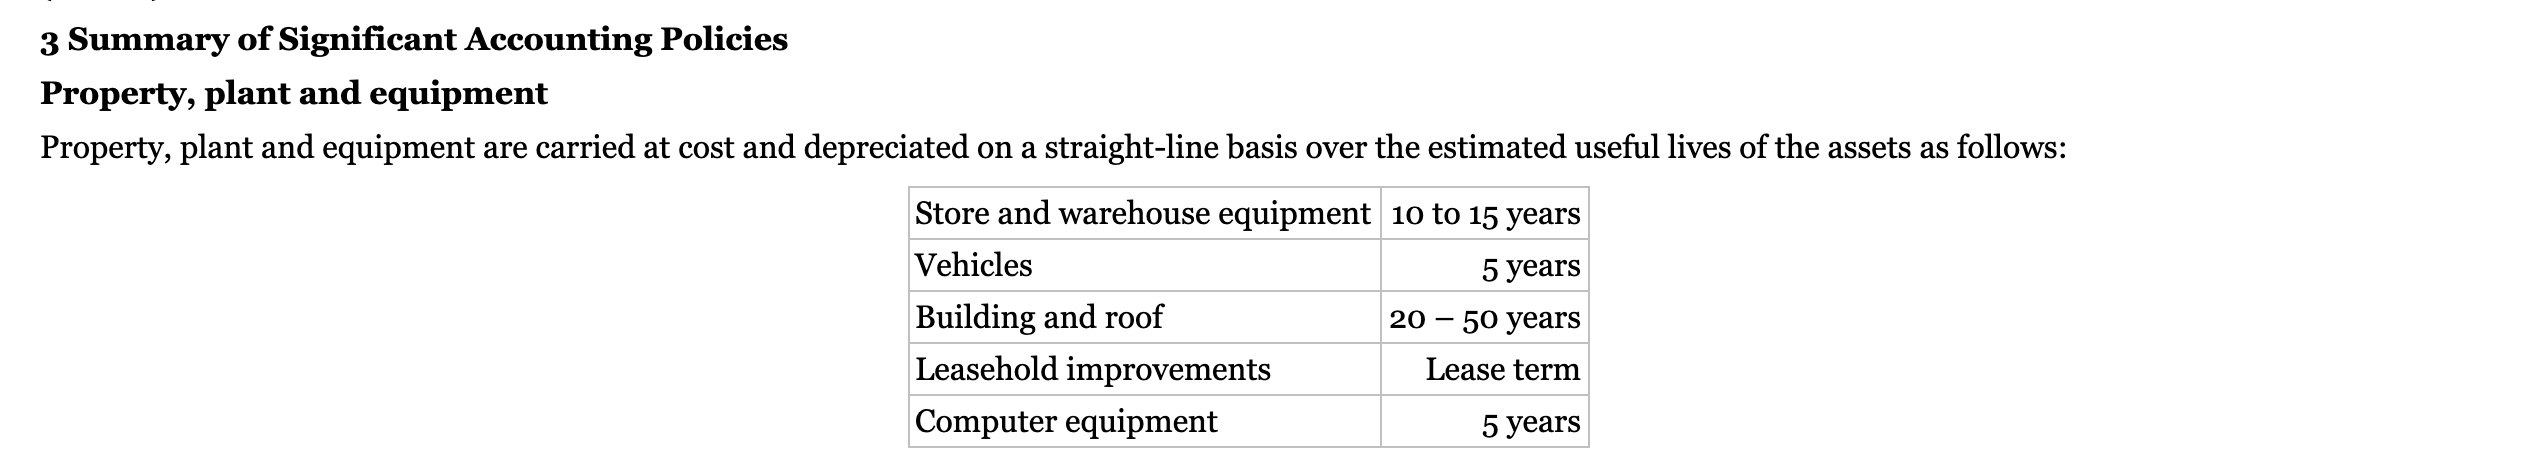
3 Summary of Significant Accounting Policies Property, plant and equipment Property, plant and equipment are carried at cost and depreciated on a straight-line basis over the estimated useful lives of the assets as follows: Store and warehouse equipment 10 to 15 years Vehicles 5 years Building and roof 20 50 years Leasehold improvements Lease term Computer equipment 5 years 6 Property, Plant and Equipment Land") Building") 2) Store and warehouse equipment Computer equipment Vehicles Leasehold improvements Total S S $ $ $ $ $ 45,779 316,349 34,012 (36) 24,596 13,346 (4,050) 33,892 4,349 1,163 (947) 4,565 249,887 37,130 (322) 286,695 595,181 153,574 (5,355) 743,400 45,779 350,325 168,517 24,111 (8) 192,620 7,648 5,995 (4,050) 9.593 1,316 927 (574) 1,669 85,475 17,175 (221) 102,429 262,956 48,208 (4,853) 306,311 45,779 157,705 24,299 2,896 184,266 437,089 Cost Balance January 31, 2016 Additions 22,144 Dispositions Balance January 29, 2017 22,144 Accumulated depreciation Balance January 31, 2016 Depreciation Dispositions Balance January 29, 2017 Net book value Balance January 29, 2017 22,144 Cost Balance February 1, 2015 Additions Dispositions Balance January 31, 2016 Accumulated depreciation Balance February 1, 2015 Depreciation Dispositions Balance January 31, 2016 Net book value Balance January 31, 2016 3,706 286,011 31,367 (1,029) 316,349 18,968 9.794 (4,166) 24,596 1,934 (1,291) 4,349 211,267 40,136 (1,516) 249,887 519,952 83,231 (8,002) 595,181 147,677 21,576 (736) 168,517 8,018 3,796 (4,166) 7,648 1,308 810 (802) 1,316 72,317 14,146 (988) 85,475 229,320 40,328 (6,692) 262,956 147,832 16,948 3,033 164,412 332,225 3 Summary of Significant Accounting Policies Property, plant and equipment Property, plant and equipment are carried at cost and depreciated on a straight-line basis over the estimated useful lives of the assets as follows: Store and warehouse equipment 10 to 15 years Vehicles 5 years Building and roof 20 50 years Leasehold improvements Lease term Computer equipment 5 years 6 Property, Plant and Equipment Land") Building") 2) Store and warehouse equipment Computer equipment Vehicles Leasehold improvements Total S S $ $ $ $ $ 45,779 316,349 34,012 (36) 24,596 13,346 (4,050) 33,892 4,349 1,163 (947) 4,565 249,887 37,130 (322) 286,695 595,181 153,574 (5,355) 743,400 45,779 350,325 168,517 24,111 (8) 192,620 7,648 5,995 (4,050) 9.593 1,316 927 (574) 1,669 85,475 17,175 (221) 102,429 262,956 48,208 (4,853) 306,311 45,779 157,705 24,299 2,896 184,266 437,089 Cost Balance January 31, 2016 Additions 22,144 Dispositions Balance January 29, 2017 22,144 Accumulated depreciation Balance January 31, 2016 Depreciation Dispositions Balance January 29, 2017 Net book value Balance January 29, 2017 22,144 Cost Balance February 1, 2015 Additions Dispositions Balance January 31, 2016 Accumulated depreciation Balance February 1, 2015 Depreciation Dispositions Balance January 31, 2016 Net book value Balance January 31, 2016 3,706 286,011 31,367 (1,029) 316,349 18,968 9.794 (4,166) 24,596 1,934 (1,291) 4,349 211,267 40,136 (1,516) 249,887 519,952 83,231 (8,002) 595,181 147,677 21,576 (736) 168,517 8,018 3,796 (4,166) 7,648 1,308 810 (802) 1,316 72,317 14,146 (988) 85,475 229,320 40,328 (6,692) 262,956 147,832 16,948 3,033 164,412 332,225Step by Step Solution
There are 3 Steps involved in it
Step: 1

Get Instant Access to Expert-Tailored Solutions
See step-by-step solutions with expert insights and AI powered tools for academic success
Step: 2

Step: 3
Ace Your Homework with AI
Get the answers you need in no time with our AI-driven, step-by-step assistance
Get Started
A Comprehensive Guide To Information Security Management And Audit
Authors: Rajkumar Banoth, Gugulothu Narsimha, Aruna Kranthi Godishala
1st Edition
1032344431, 978-1032344430