question regarding marketing research using statistical outputs. Unsure which statistical outputs to use for the question asked and how to interpret.
The data analyses outputs are included after the set of questions in the Appendix, and please choose the relevant analysis and results from there to address your assigned question.
Note: please ignore the questions in the case. Please feel free to cut and paste relevant outputs in the appendix when discussing about them in answering each question.
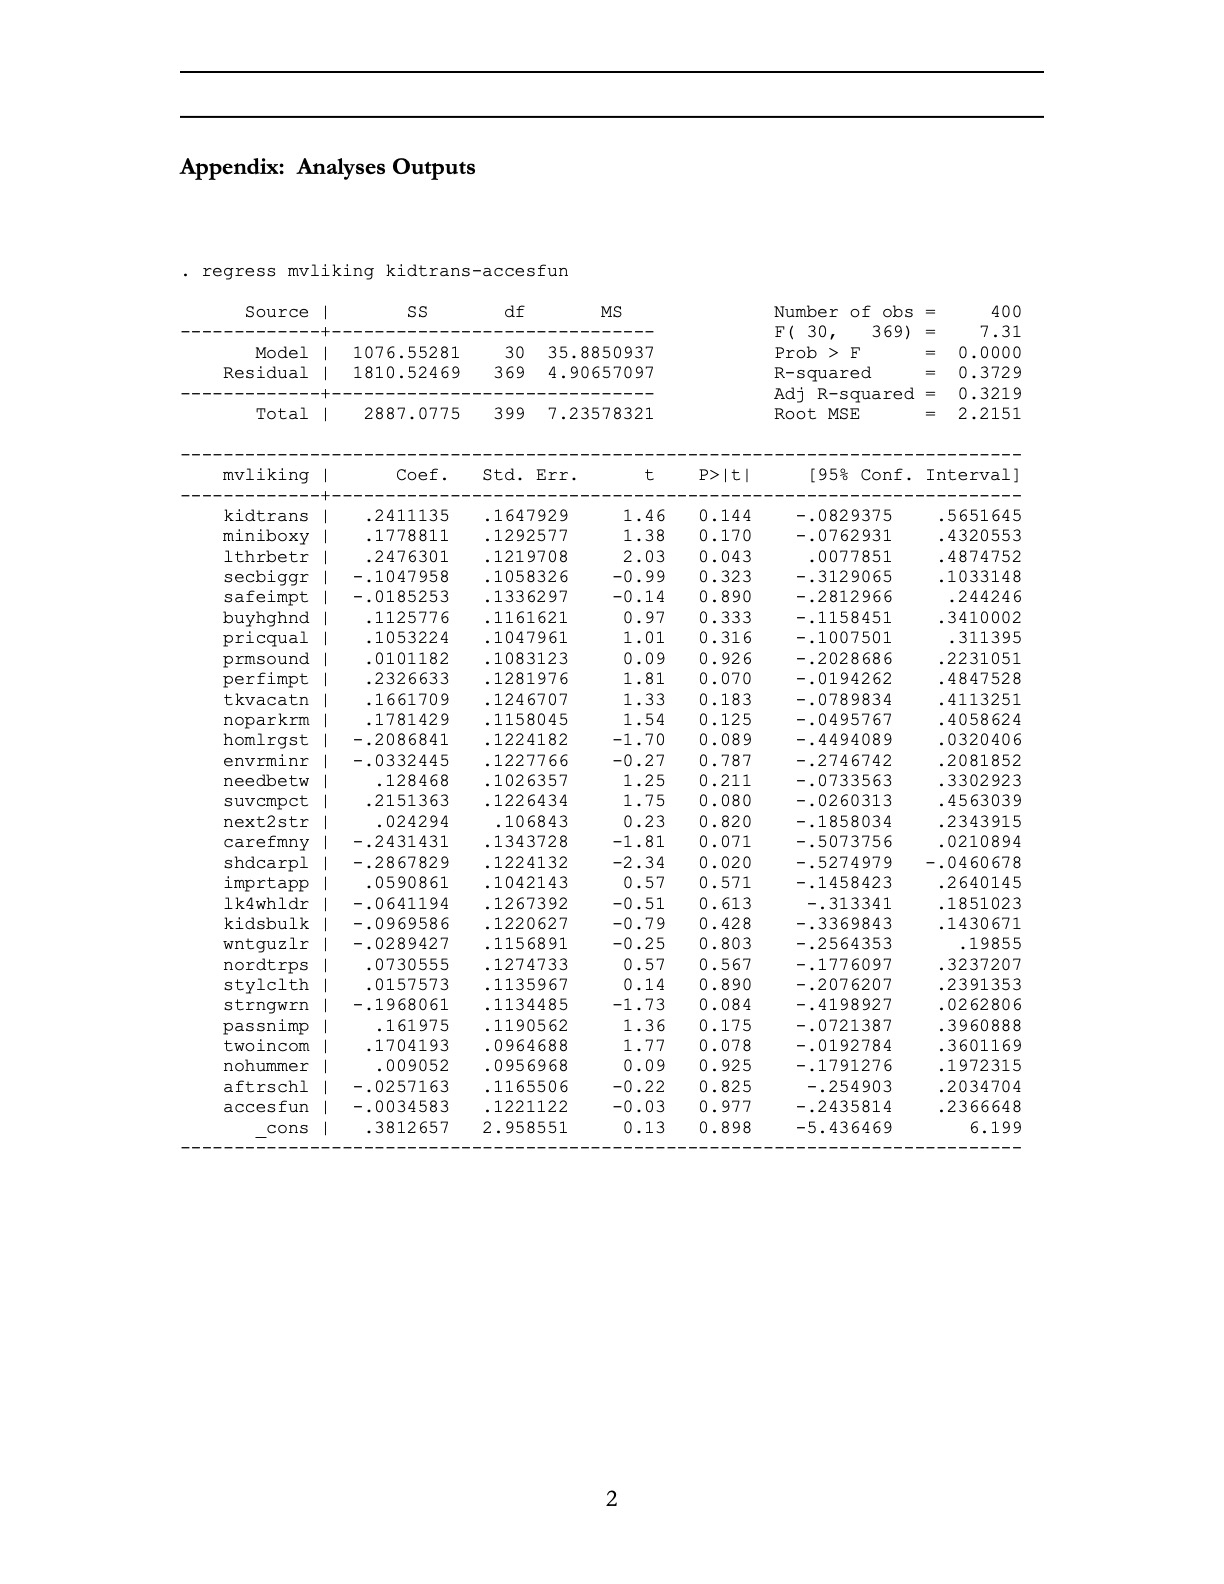
- Managers would like to understand the customer attitudes that could drive their purchases. Please determine whether there is a relationship between the 30 attribute variables and the target mvliking variable. What do you find? (Please use the relevant output in the Appendix)
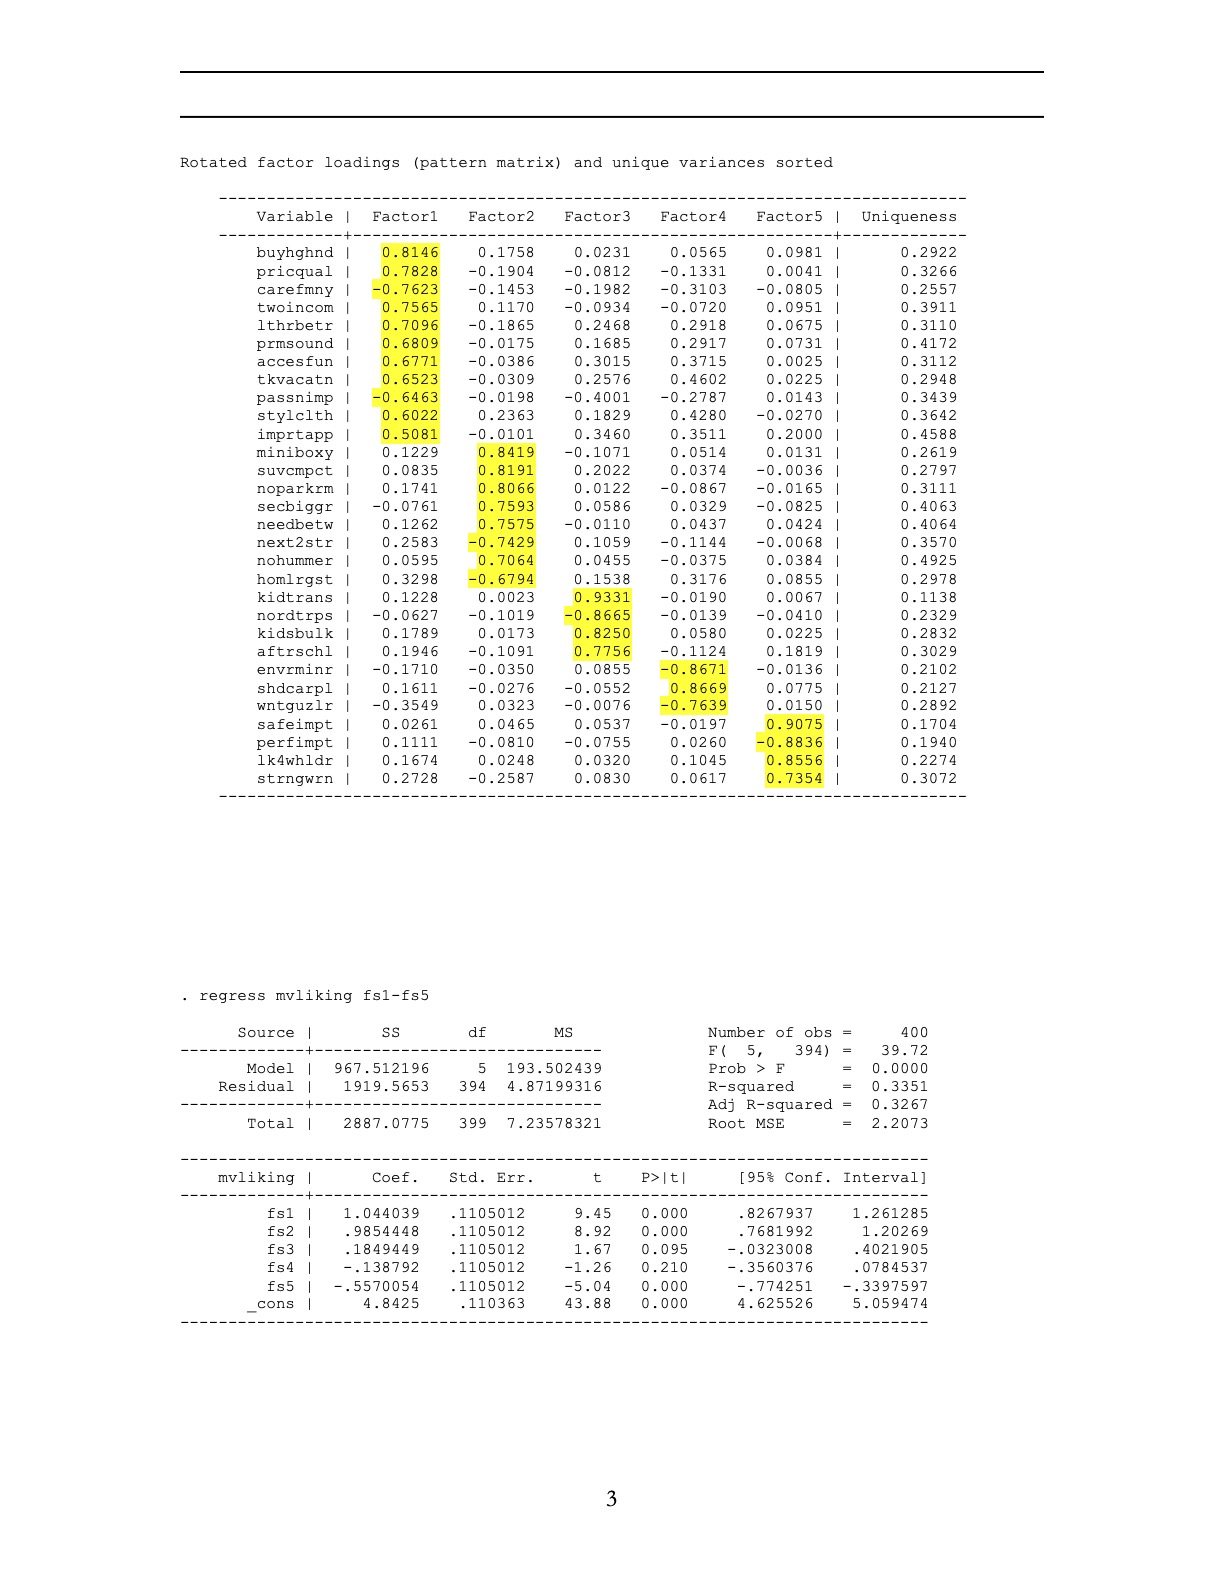
- The analyses run thus far address how well the 30 attribute variables explain the mvliking variable. These results may be more interpretable by uncovering the degree of redundancy in the 30 attribute variables. How would you assess this? (Hint: please provide descriptive names for the underlying constructs.)
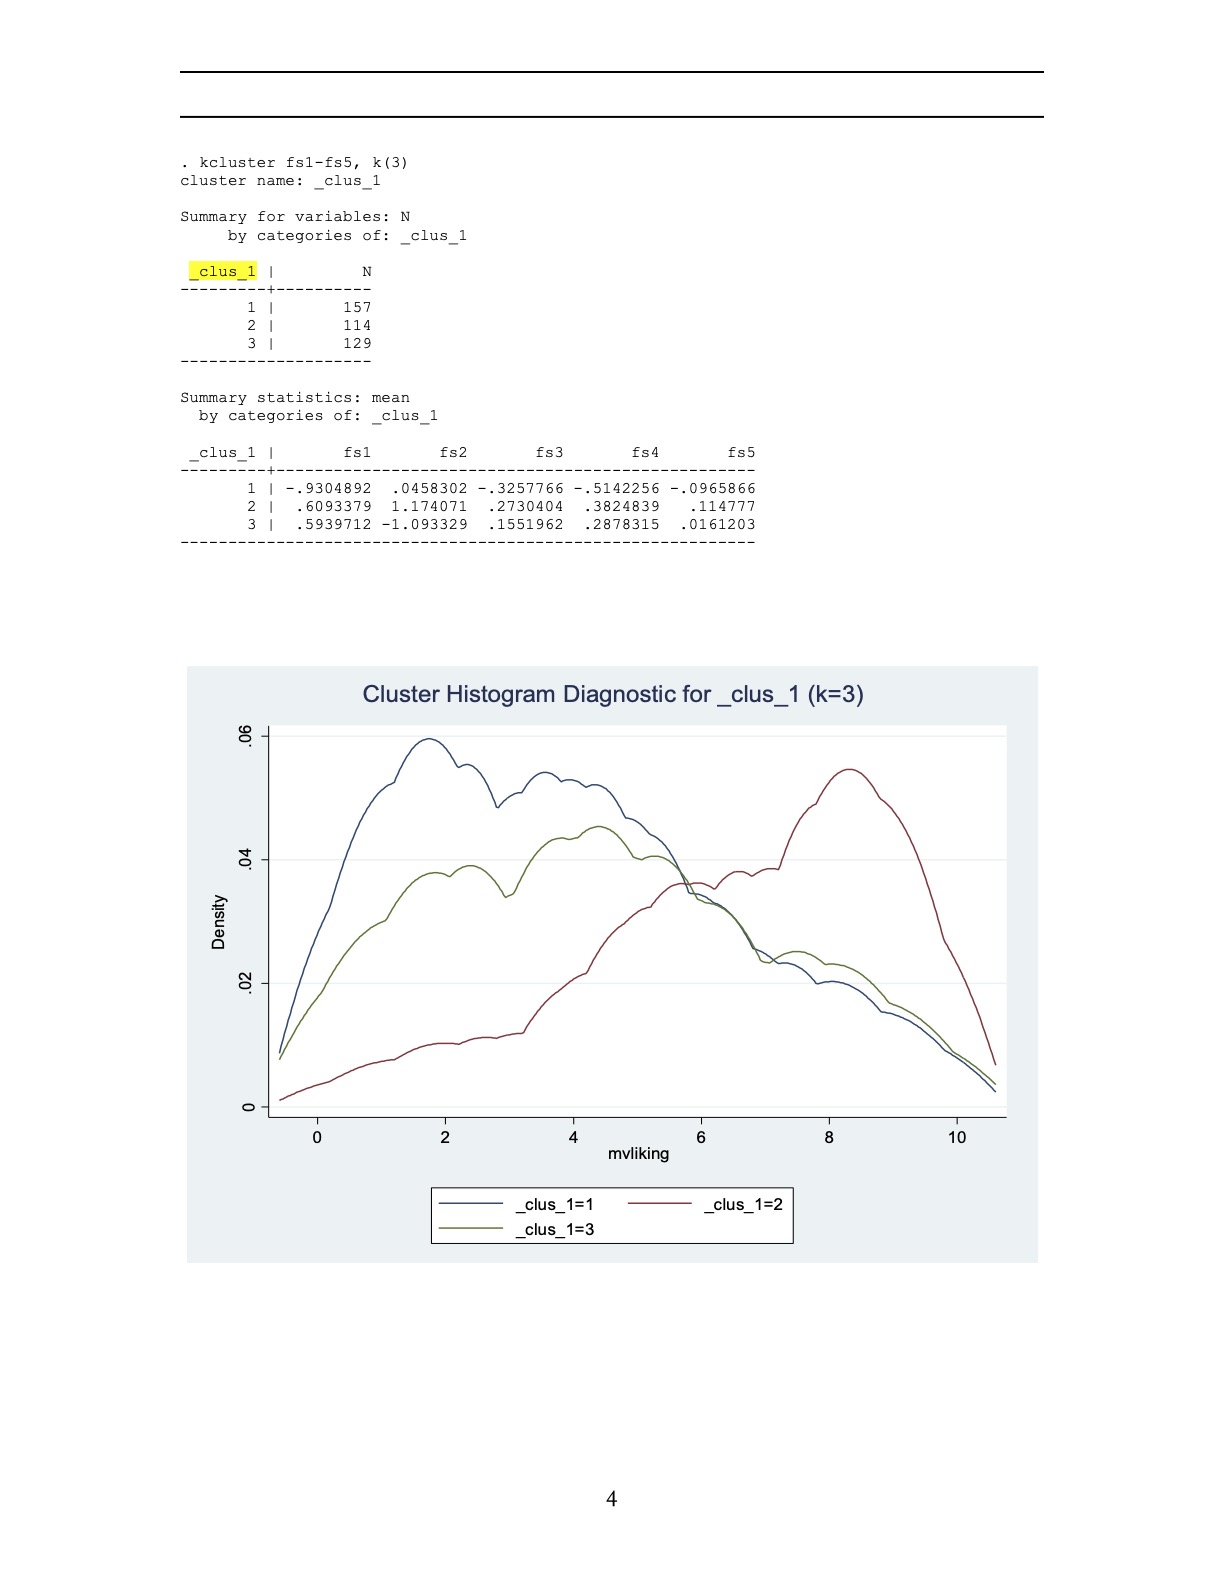
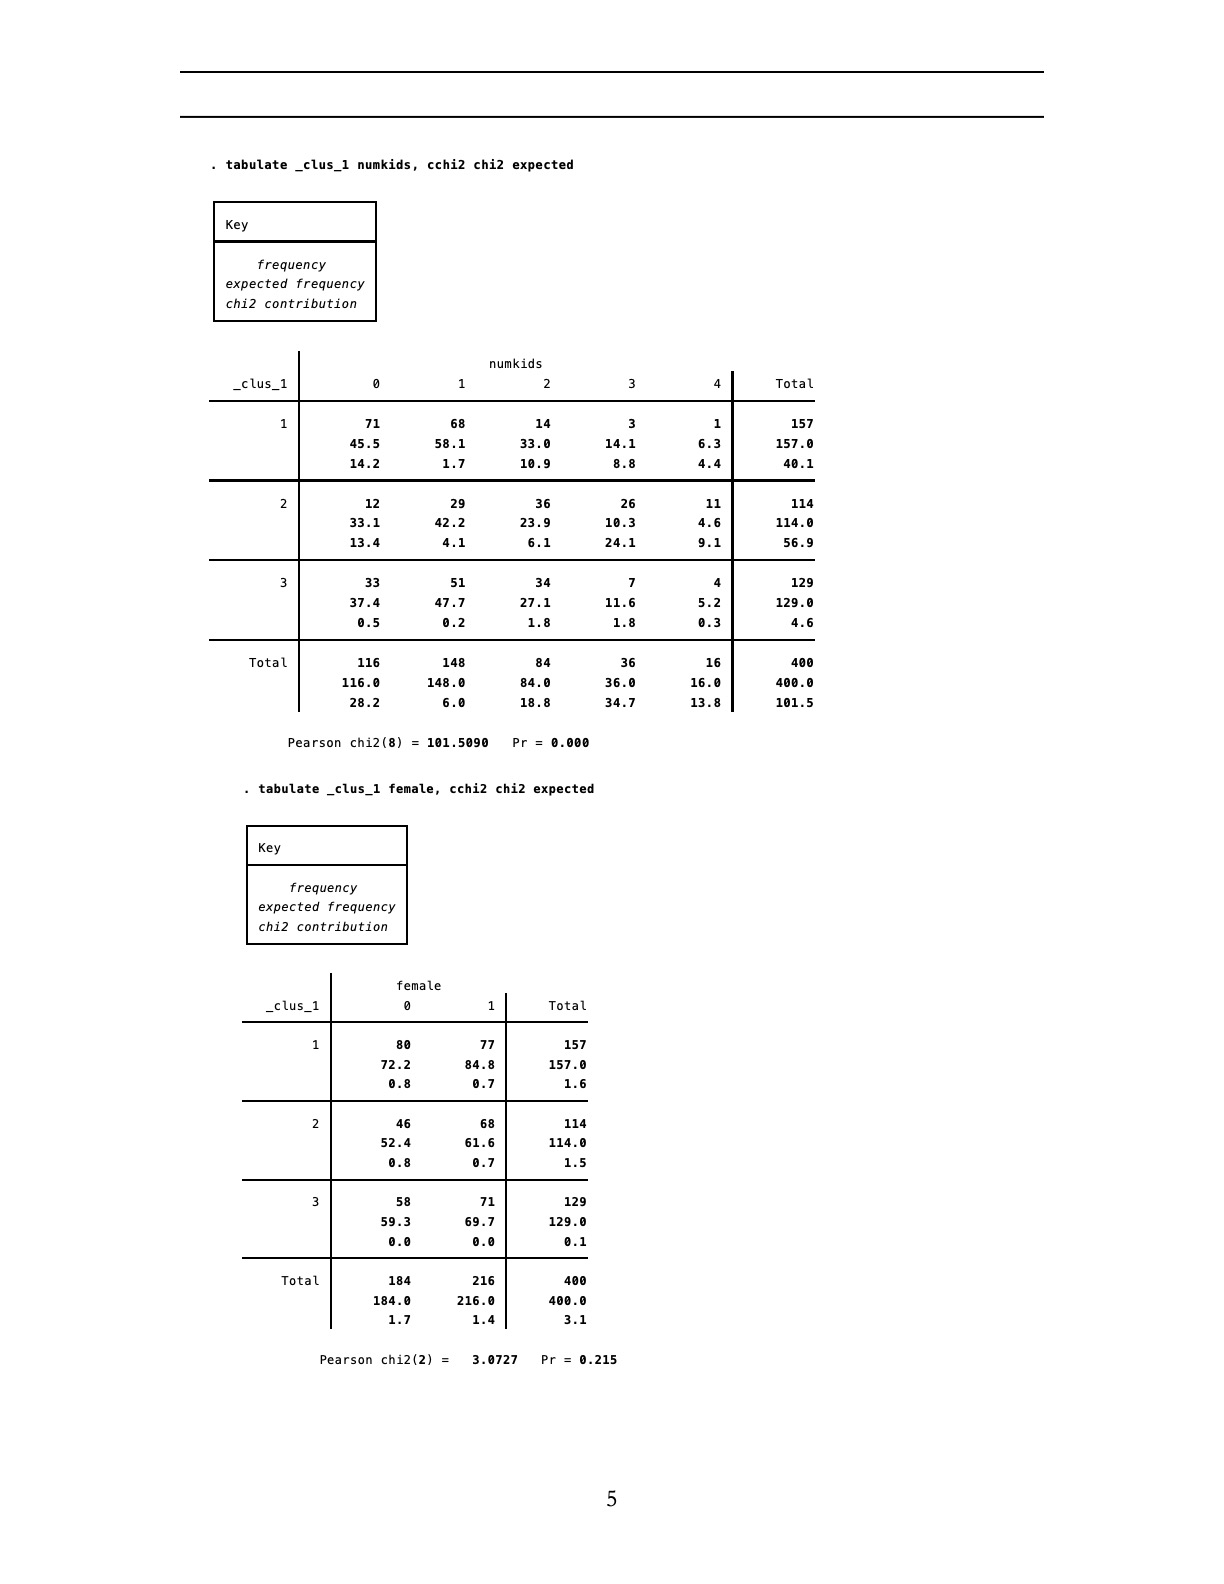
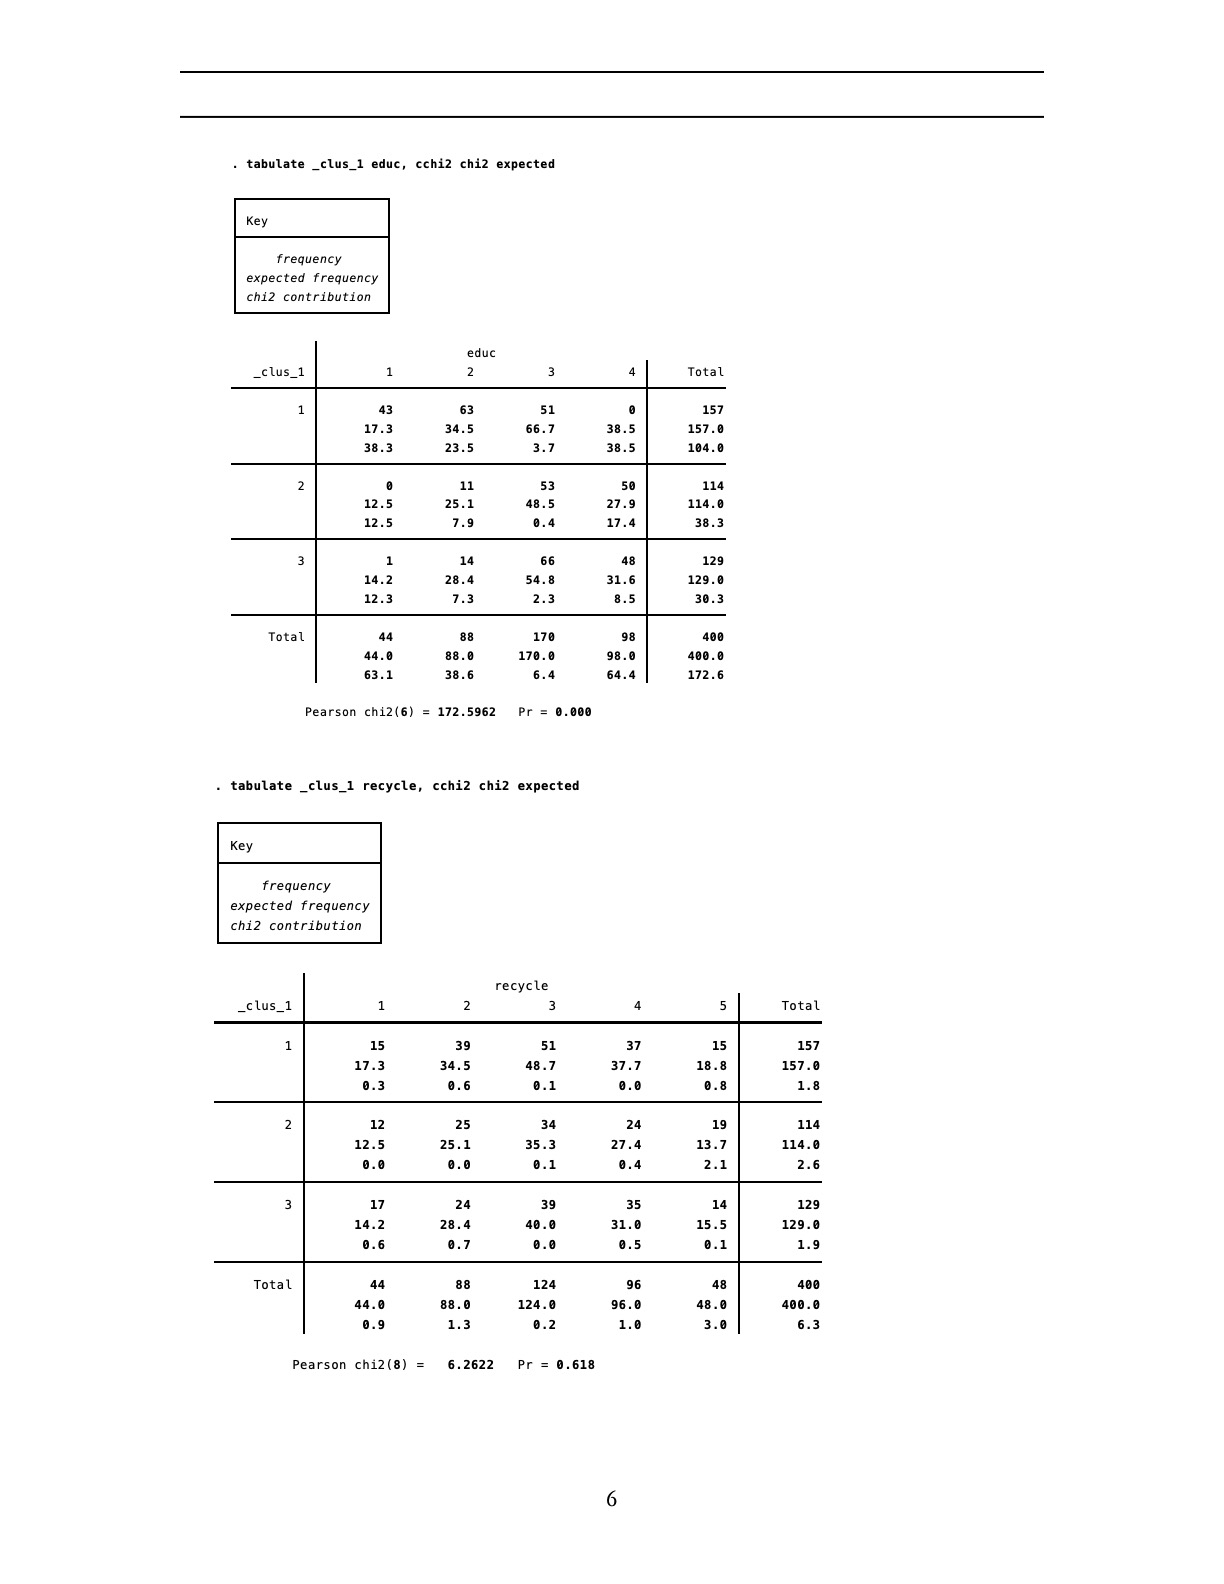
Appendix: Analyses Outputs regress mvliking kidtrans-accesfun Source SS df MS Number of obs 400 F ( 30 , 369) = 7.31 Model 1076.5528 30 35. 8850937 Prob > F = 0. 0000 Residual 1810 .52469 369 4. 90657097 R-squared = 0. 3729 Adj R-squared = 0. 3219 Total 2887. 0775 399 7.23578321 Root MSE 2. 2151 mvliking Coef. Std. Err. P>It 95% Conf. Interval] kidtrans 2411135 1647929 1 . 46 0. 144 - . 0829375 5651645 miniboxy 1778811 . 1292577 1 .38 0. 170 . 0762931 4320553 1thretr . 2476301 . 1219708 2.03 0 . 043 0077851 4874752 secbiggr . 1047958 . 1058326 -0 . 99 0. 323 . 3129065 1033148 safeimpt . 0185253 . 1336297 -0. 14 0. 890 - . 2812966 244246 buyhghnd . 1125776 . 1161621 0.97 0. 333 . 1158451 3410002 pricqual . 1053224 1047961 1 . 01 0 . 316 -. 1007501 . 311395 prmsound . 0101182 . 1083123 0 . 09 0. 926 -. 2028686 2231051 perfimpt . 2326633 1281976 1. 81 0 . 070 - . 0194262 4847528 tkvacatn 1661709 . 1246707 1.33 0. 183 - . 0789834 4113251 noparkrm 1781429 . 1158045 1.54 0 . 125 - . 0495767 . 4058624 homlrgst -. 2086841 1224182 -1 . 70 0 . 089 -. 4494089 0320406 envrminr -. 0332445 . 1227766 -0.27 0. 787 -. 2746742 2081852 needbetw . 128468 1026357 1.25 0 . 211 . 0733563 3302923 suvempct 2151363 . 1226434 1 . 75 0 . 080 -. 0260313 4563039 next2str 024294 . 106843 0.23 0 . 820 -. 1858034 2343915 carefmny -. 2431431 . 1343728 -1 . 81 0. 071 . 5073756 . 0210894 shdcarpl -. 2867829 . 1224132 -2.34 0 . 020 -. 5274979 . 0460678 impreapp 0590861 . 1042143 0.57 0 . 571 -. 1458423 . 2640145 1k4whidr - . 0641194 .1267392 -0 . 51 0 . 613 -. 313341 1851023 kidsbulk . 0969586 . 1220627 -0. 79 0 . 428 -. 3369843 . 1430671 wntguzlr . 0289427 . 1156891 -0. 25 0. 803 - . 2564353 . 19855 nordtrps 0730555 1274733 0. 57 0 . 567 -. 1776097 3237207 stylclth 0157573 . 1135967 0.14 0 . 890 -. 2076207 2391353 strngwrn -. 1968061 . 1134485 -1. 73 0 . 084 - . 4198927 . 0262806 passnimp . 161975 1190562 1.36 0. 175 -. 0721387 3960888 twoincom . 1704193 0964688 1. 77 0. 078 - . 0192784 3601169 nohummer 009052 0956968 0. 09 0. 925 -. 1791276 1972315 aftrschl -. 0257163 . 1165506 -0. 22 0 . 825 -. 254903 . 2034704 accesfun - . 0034583 . 1221122 -0. 03 0. 977 -. 2435814 . 2366648 cons . 3812657 2. 958551 0.13 0. 898 -5. 436469 6. 199 NRotated factor loadings (pattern matrix) and unique variances sorted Variable Factorl Factor2 Factor3 Factor4 Factor5 Uniqueness ---- buyhghnd 0 . 8146 0 . 1758 0. 0231 0 . 0565 0. 0981 ). 2922 pricqual 0 . 7828 -0 . 1904 0 . 0812 0. 1331 0 . 0041 0 . 3266 carefmny -0. 7623 -0. 1453 -0 . 1982 -0. 3103 -0. 0805 0 . 2557 twoincom 0 . 7565 0. 1170 -0. 0934 -0. 0720 0. 0951 0 . 3911 1thretr 0 . 7096 -0. 1865 0. 2468 0 . 2918 0. 0675 0 . 3110 prmsound 0 . 6809 -0 . 0175 0. 1685 0. 2917 0. 0731 0 . 4172 accesfun 0 . 6771 -0. 0386 0 . 3015 0. 3715 0. 0025 . 3112 tkvacatn 0 . 6523 -0. 0309 0. 2576 0 . 4602 0 . 0225 0 . 2948 passnimp -0. 6463 -0 . 0198 0 . 4001 0. 2787 0 . 0143 0 . 3435 stylolth 0 . 6022 0 . 2363 0. 1829 0 . 4280 -0. 0270 0. 3642 impra 0 . 5081 -0 . 0101 0 . 3460 0 . 3511 0. 2000 0 . 4588 miniboxy 0 . 1229 0 . 8419 -0. 1071 0 . 0514 0 . 0131 0. 2619 suvempct 0 . 0835 0 . 8191 0. 2022 0 . 0374 -0. 0036 0. 2797 noparkrm 0 . 1741 0 . 8066 0 . 0122 -0. 0867 -0. 0165 0 . 3111 secbiggr -0 . 0761 0 . 7593 0 . 0586 0. 0329 -0. 0825 0 . 4063 needbetw 0 . 1262 0 . 7575 -0 . 0110 0. 0437 0 . 0424 0 . 4064 next2str 0 . 2583 -0. 7429 0. 1059 -0. 1144 -0 . 0068 0 . 3570 nohummer 0 . 0595 0. 7064 0 . 0455 -0. 0375 0. 0384 0. 4925 homirgst 0 . 3298 -0. 6794 0 . 1538 0 . 3176 0. 0855 . 2978 kidtrans 0 . 1228 0 . 0023 0. 9331 -0 . 0190 0. 0067 0 . 1138 nordtrps -0 . 0627 -0 . 1019 -0 . 8665 -0. 0139 -0. 0410 . 2329 kidsbulk 0. 1789 0 . 0173 0 . 8250 0 . 0580 0 . 0225 0. 2832 aftrschl 0. 1946 -0 . 1091 0. 7756 -0. 1124 0. 1819 0 . 3029 envrminr -0 . 1710 -0. 0350 0. 0855 -0. 8671 -0. 0136 0. 2102 shdcarpl 0. 1611 -0. 0276 -0 . 0552 0. 8669 0. 0775 0. 2127 wntguzlr -0 . 3549 0. 0323 -0 . 0076 -0. 7639 0 . 0150 . 2892 safeimpt 0 . 0261 0 . 0465 0. 0537 -0. 0197 0. 9075 . 1704 perfimpt 0 . 1111 -0 . 0810 -0 . 0755 0 . 0260 -0. 8836 0. 1940 1k4whldr 0 . 1674 0 . 0248 0. 0320 0. 1045 0 . 8556 0. 2274 strngwrn 0. 2728 -0. 2587 0. 0830 0. 0617 0. 7354 0 . 3072 regress mvliking fs1-fs5 Source SS df MS Number of obs = 400 F( 5, 394) = 39.72 Model 967 . 512196 5 193 . 502439 Prob > F 0 . 0000 Residual 1919.5653 394 4. 87199316 R-squared 0. 3351 Adj R-squared = 0. 3267 Total 2887.0775 399 7. 23578321 Root MSE 2. 2073 mvliking Coef. Std. Err. P>It) [95% Conf. Interval] fs1 1. 044039 . 1105012 9 . 45 0 . 000 8267937 1 . 261285 fs2 9854448 1105012 8 . 92 0 . 000 . 7681992 1 . 2026 fs3 1849449 1105012 1 . 67 0 . 095 - . 0323008 4021905 fs4 - . 138792 . 1105012 1 . 26 0 . 210 - . 3560376 . 0784537 fs5 - . 5570054 . 1105012 -5. 04 0. 000 - . 774251 -. 3397597 cons 4 . 8425 . 110363 43.88 0. 000 4. 625526 5. 059474 3. kcluster fs1-fs5, k(3) cluster name: clus_1 Summary for variables: N by categories of: _clus_1 clus 1 | N ---------+- 157 114 WNI 120 Summary statistics: mean by categories of: _clus_1 clus 1 fs1 fs2 fs 3 fs4 fs 5 - --------+- . 9304892 . 0458302 -. 3257766 5142256 . 0965866 . 6093379 1. 174071 . 2730404 . 3824839 . 114777 . 5939712 -1. 093329 . 1551962 . 2878315 . 0161203 Cluster Histogram Diagnostic for _ clus_1 (k=3) 04 Density O N 6 8 10 mvliking clus_1=1 clus_1=2 clus_1=3 4. tabulate _clus_1 numkids, cchi2 chi2 expected Key frequency expected frequency chi2 contribution numkids 0 1 2 3 Total clus_1 71 68 14 3 1 157 45.5 58. 1 33. 14.1 5.3 157. 14.2 1 . 7 10. 8 . 8 4. 4 40.1 12 29 36 26 11 114 33.1 2.2 23. 9 10.3 4. 6 114. 6 13. 4 4.1 6.1 24.1 9. 1 56.9 53 51 34 7 129 37. 47.7 27. 1 1. 5.2 129. 1. 8 1.8 4.6 148 84 36 400 Total 116 16 116. 0 148 . 84. 36.0 16. 0 400 . 28 . 2 6.0 18. 8 34.7 13. 8 101.5 Pearson chi2 (8) = 101.5090 Pr = 0.000 . tabulate _clus_1 female, cchi2 chi2 expected Key frequency expected frequency chi2 contribution female _clus_1 0 Total 1 80 77 157 72.2 34.8 157 . 0 9. 8 9 7 1.6 2 46 114 2.4 61. 114. 6 . 8 0 . 7 1.5 3 RC 71 129 9.3 59.7 129.0 0.0 0.0 0.1 Total 184 216 400 184. 0 216. 400.0 1.7 1.4 3.1 Pearson chi2 (2) = 3. 0727 Pr = 0.215 5. tabulate _clus_1 educ, cchi2 chi2 expected Key frequency expected frequency chi2 contribution educ 2 3 Total clus_1 157 63 51 34.5 56. 7 38.5 157. 0 17. 3 38.5 38.3 23.5 104. 0 114 2 11 25.1 8 . 5 27.9 114. 0 12.5 17. 38 .3 2.5 66 129 3 14 28. 54.8 31.6 129. 0 14.2 7.3 8.! 30.3 12.3 400 Total 88 170 170. 8. 100.0 44.0 88 . 0 38.6 6. 4 64.4 172. 53. 1 Pearson chi2 (6) = 172.5962 Pr = 0.000 . tabulate _clus_1 recycle, cchi2 chi2 expected Key frequency expected frequency chi2 contribution recycle Total 3 5 _clus_1 1 2 157 31 15 15 39 51 37. 18.8 157.0 17.3 34.5 48. 0 .8 1.8 0 . 6 114 24 19 2 25 34 7.4 13.7 114.0 12.5 25. 1 35.3 0 . 1 0. 4 2.1 2.6 0.0 14 129 24 39 35 3 17 129. 0 14. 28. 4 40. 31.0 15.5 0 . 1 1.9 0 .6 0.7 0.5 400 90 Total 124 44 88 124. 48. 0 100. 44. 18. 6.0 3.0 6.3 1.3 0.2 1. 0 Pearson chi2 (8) = 6.2622 Pr = 0. 618 6
