

Question
QUESTION Should the remaining shareholders sell their shares at the offer price of $1.30 per share, or hold out for a better price? Should bondholders
QUESTION
Should the remaining shareholders sell their shares at the offer price of $1.30 per share, or hold out for a better price? Should bondholders of CMA, CGA and NOL be concerned about the acquisition? Make your case with facts and theory-based arguments.
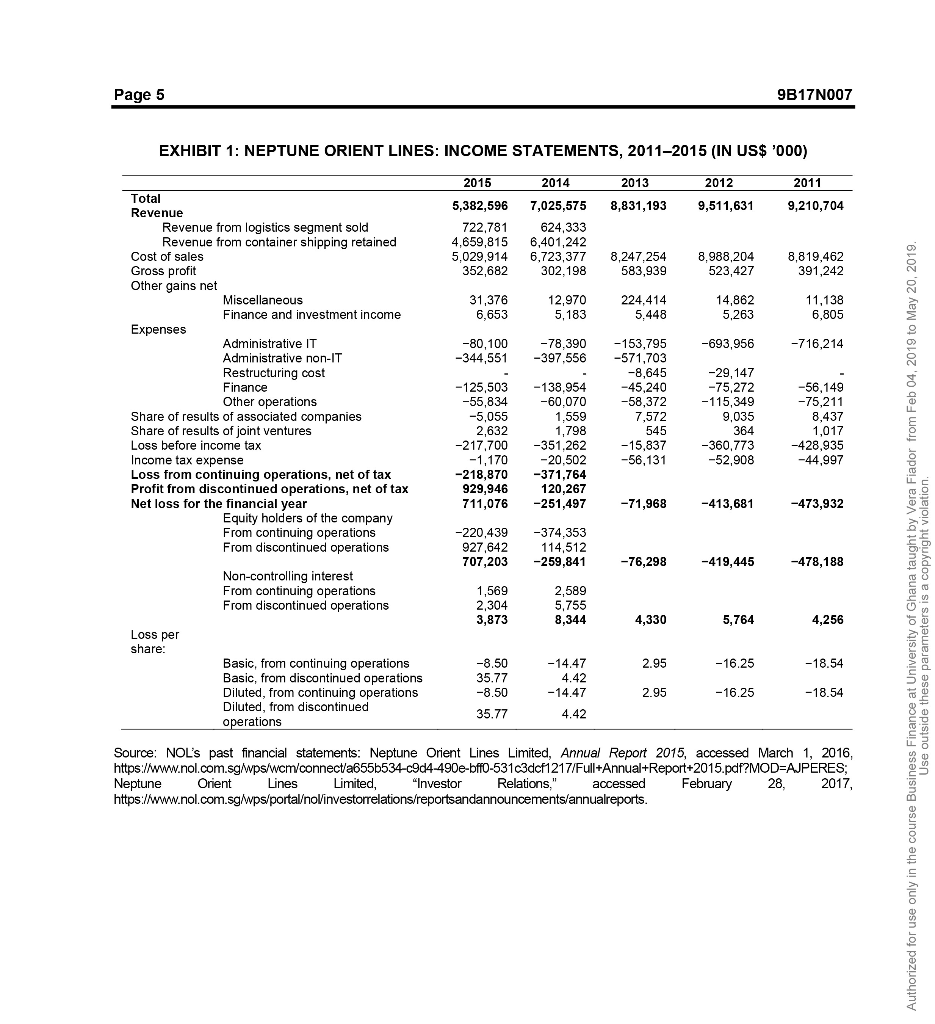
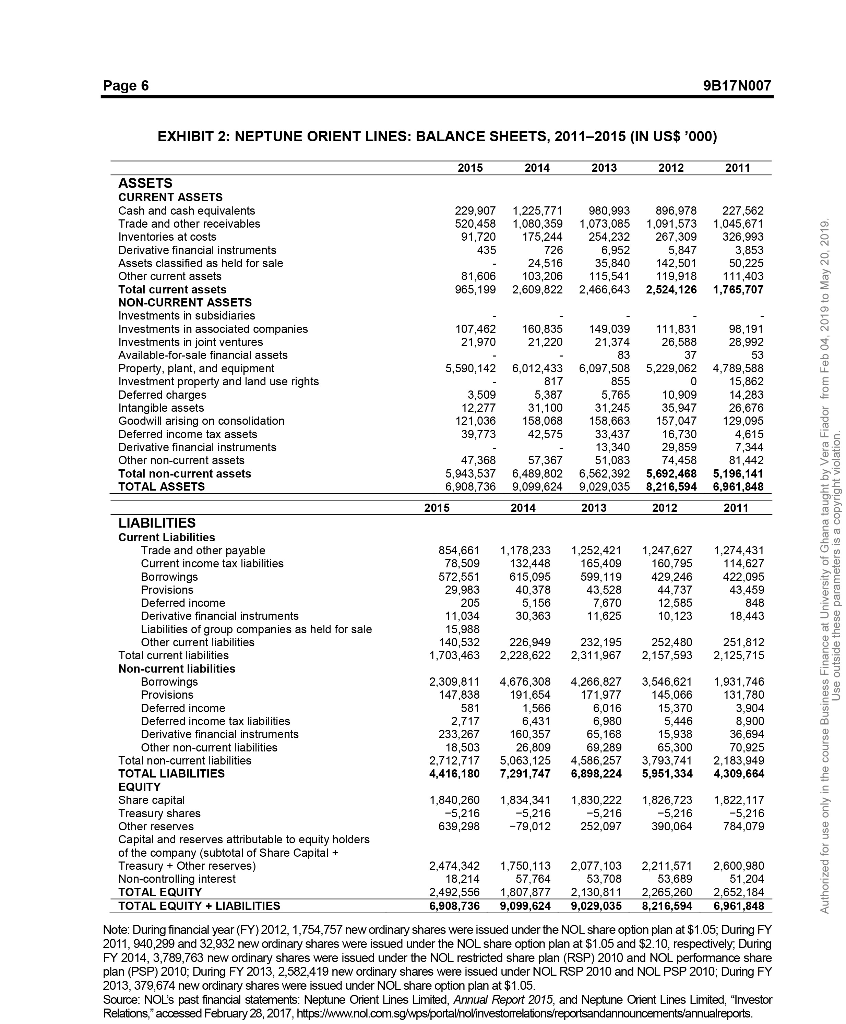
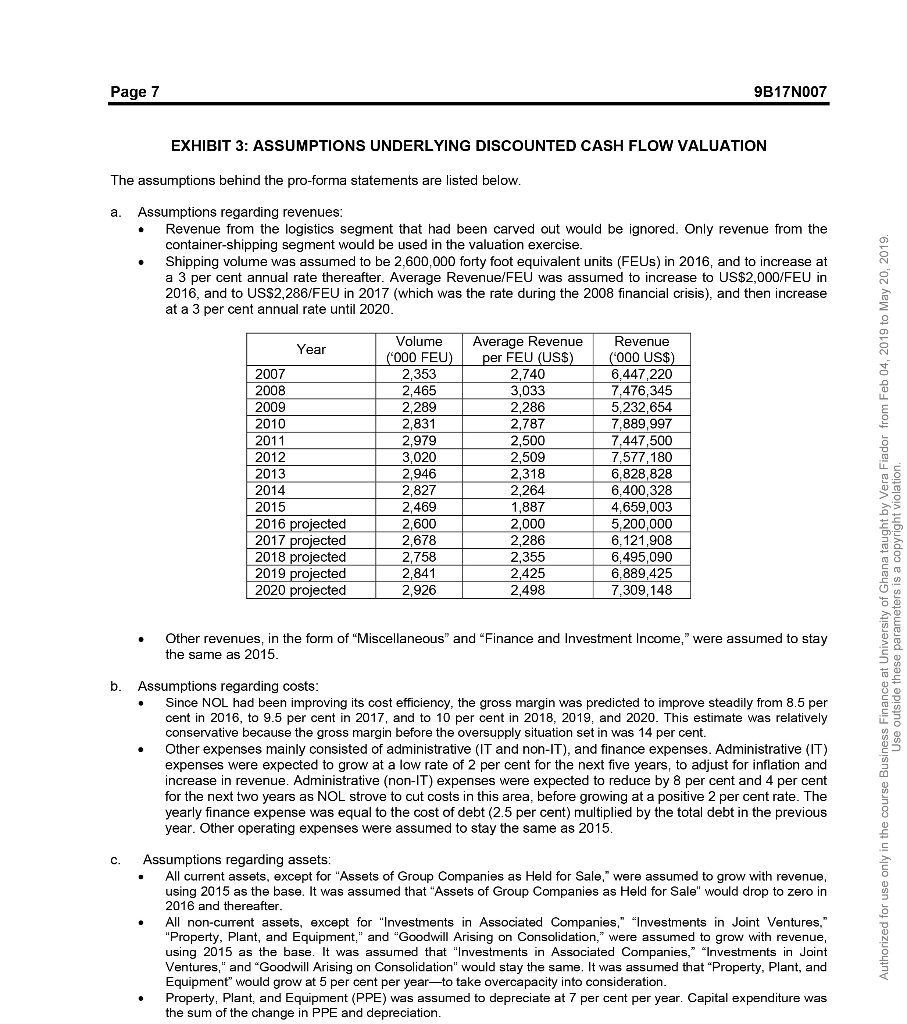
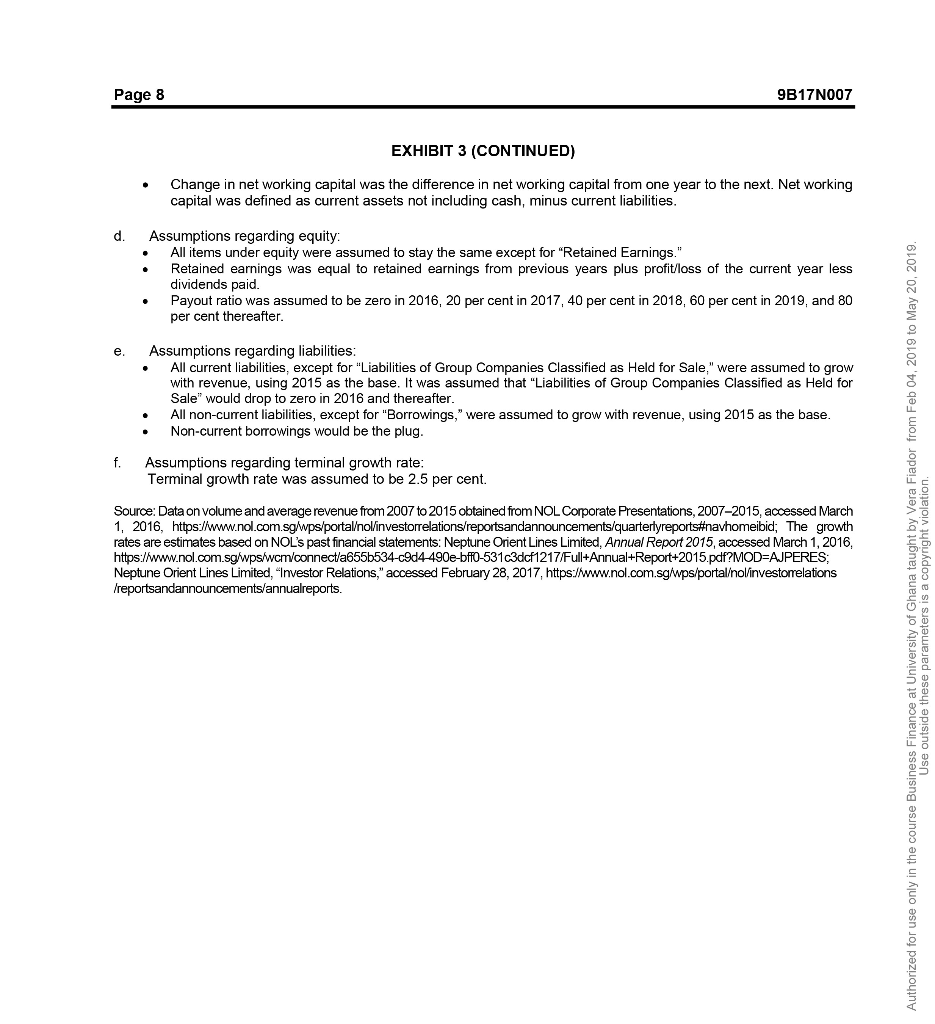
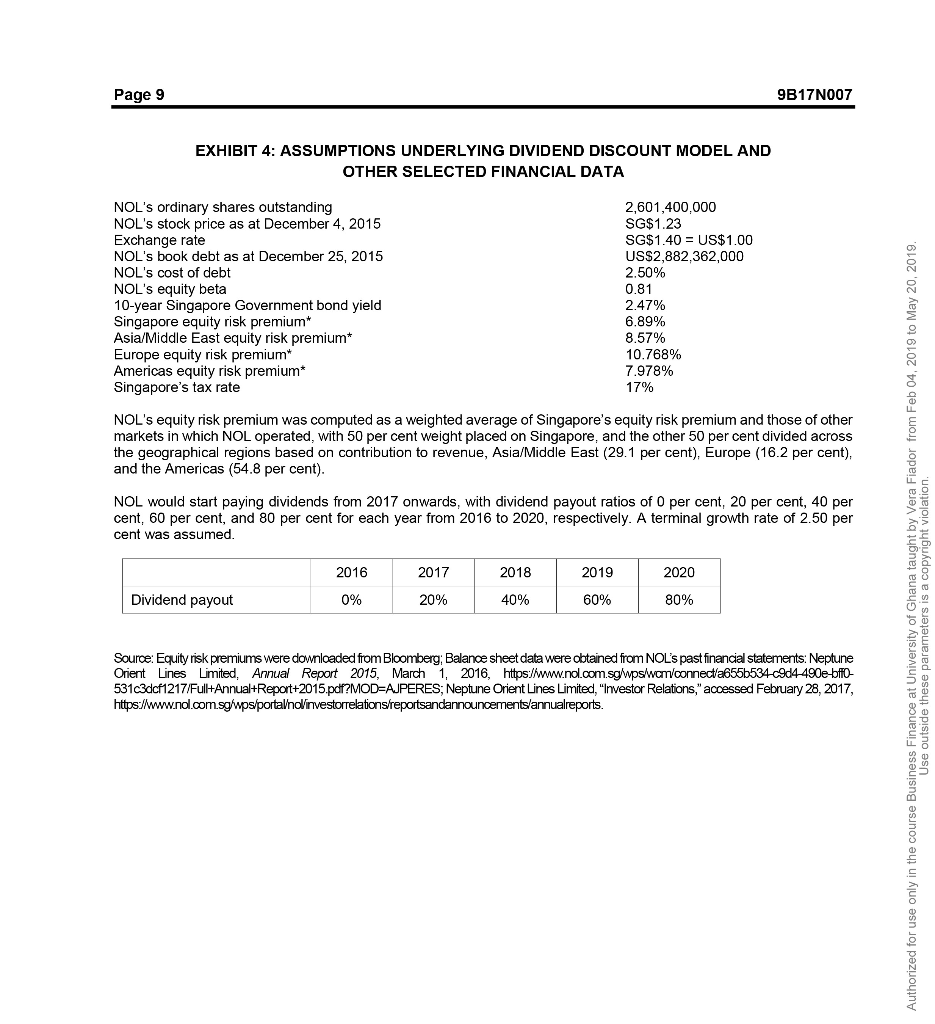
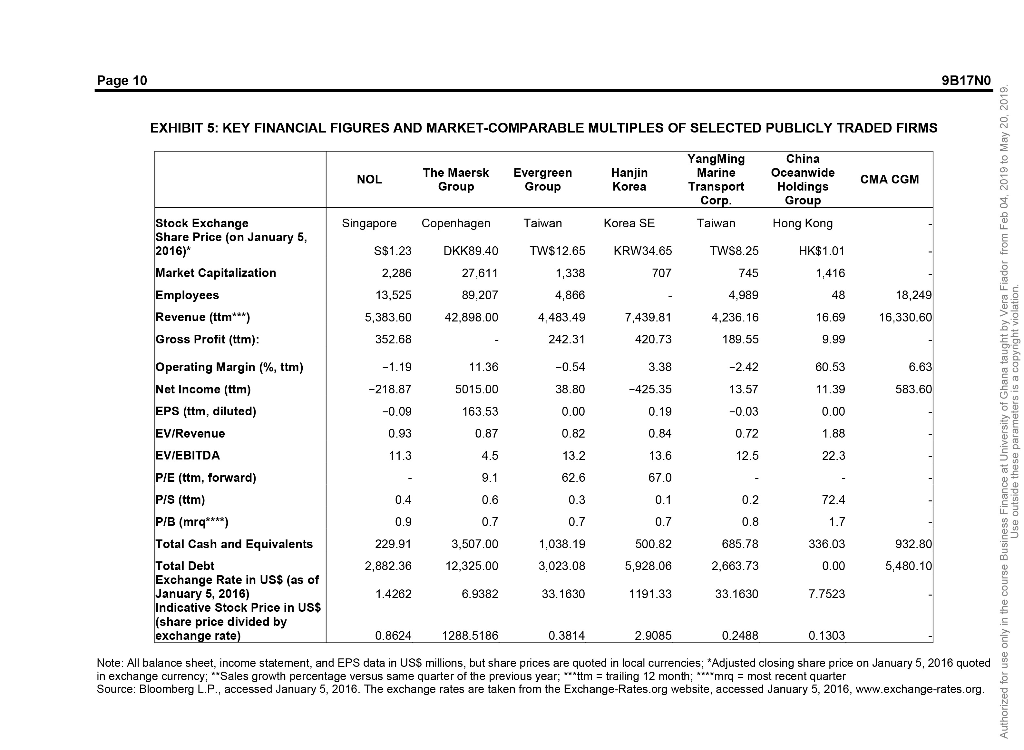
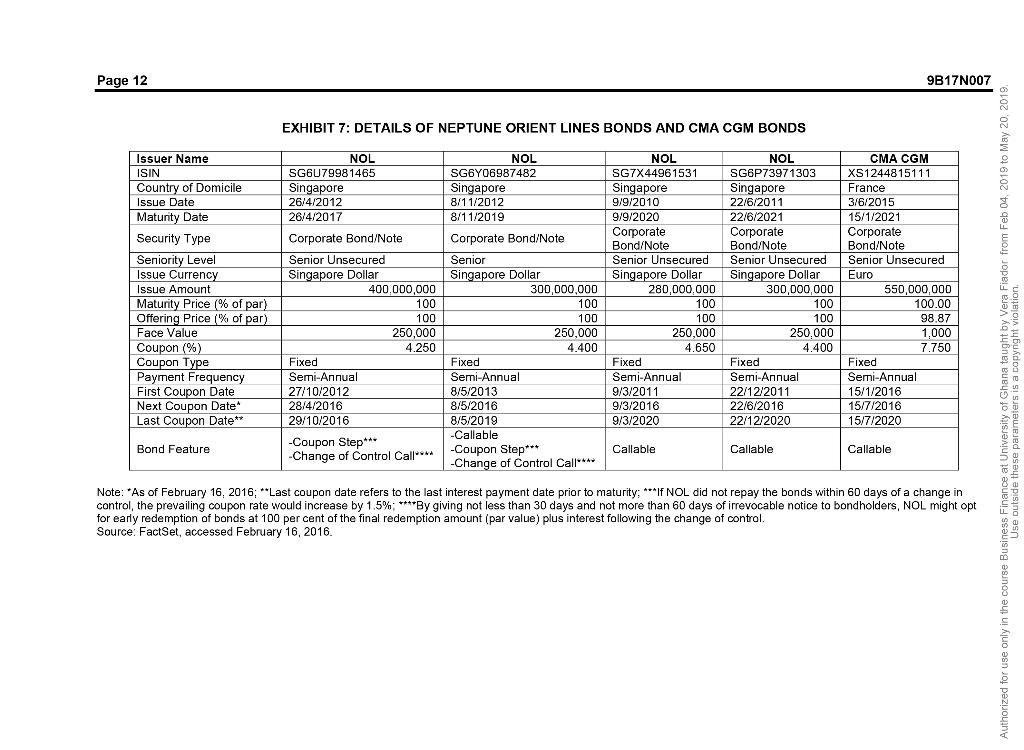
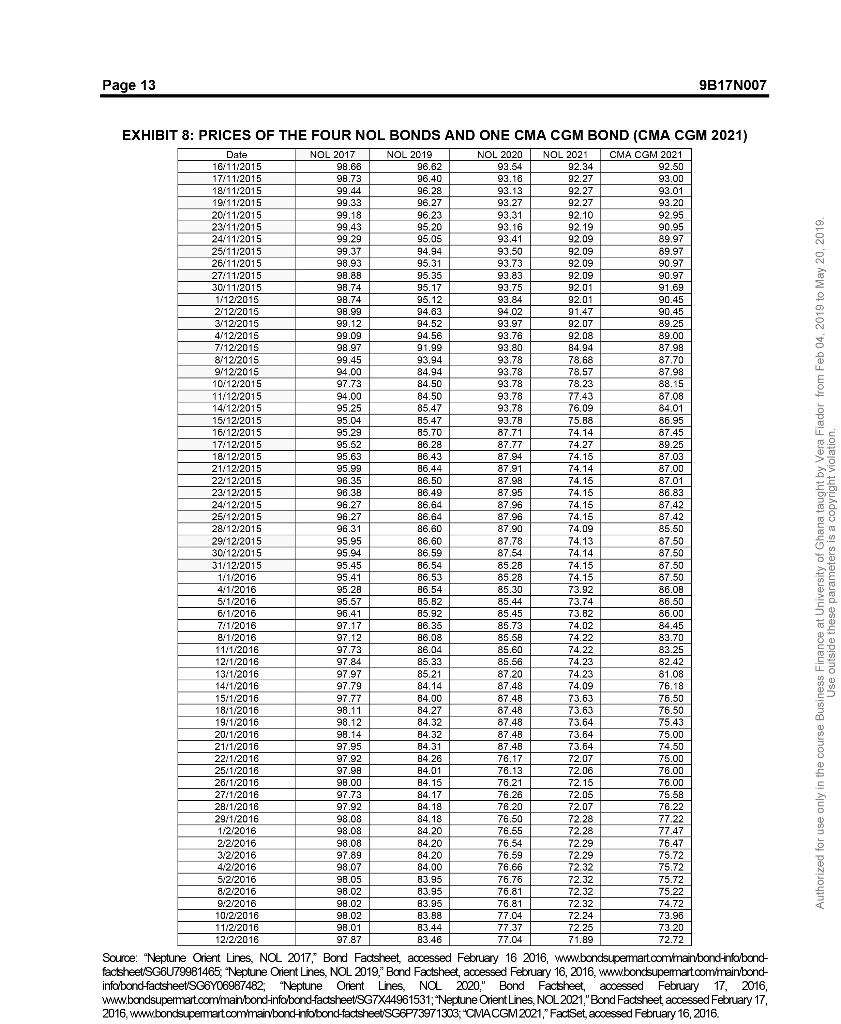
Page 2 9B17N007 recorded a net loss of USS741 million. This decline was followed by an amazing turnaround of its fortunes in 2010, which saw a nct profit for the company of USS461 million. Howcver, thc pcrformancc could not be sustained. NOL dipped into the red again, with losses of US$478 million in 2011, USS419 million in 2012, US$76 million in 2013,8 and US$260 million in 2014,9 for a total loss of US$1.233 billion ovcr this four-ycar pcriod. In licbruary 2015, NOL sold the profit-making APL for USS1.2 billion to concentrate on its container-shipping business,10 which had grown to become the 12th largest in the world In November 2015, it was announced that French shipping giant CMA CGM was in exclusive discussions to buy Singaporc icon NOL. With its high debt levcls and inability to rcturn to profitability, NOL had becrn looking for a buyer for months.12 CMA CGM was the world's third-largest container-shipping firm, and was privatcly owned by the billionaire Saad family. On the deadlinc to complete duc diligence, December 7, 2015, CMA CGM offcred S1.30 cash for cach of NOL sharcs.13 Thc company intended to takc NOL privatc and also planned to sell assets worth $1.4 billion from the merged entity to reduce debt.15 Temasek's head of portfolio management said We are supportive of this transaction [because] it presents NOL with an opportunity to join a leading playcr with an extensive global presence and solid operational track record. We also note and wclcome thc commitmcnt of CMA CGM to cnhancc Singaporc's position as a kcy maritimc hub, and grow Singapore s container throughput volumes The offer was subject to the approval of the American, European, and Chinese regulators.16 WHY SELL A NATIONAL ICON? According to the dircctor of rescarch at Drewry Shipping Consultants Limited, NOL was suffcring from overcapacity in the container-shipping industry and from falling freight rates: "The 2015 volume total is on coursc to be the lowest sincc 2009, whilc avcragc freight rates arc destincd to bc thc lowest in at lcast a decade. It's a toxic combination that the management has failed to arrest, and Temasek appears to have seen the writing on the wall that a turnaround is not imminent." NOL's deputy chief executive and chief financial officer in the 1990s felt that NOL might fetch a better price if it waitcd, "but thcrc's also thc worry that if thcy don't scll now, thcre may not bc a suitor later." Although the offer price was 0.96 times NOL's book value, Ocean Chinese Banking Corporation Investment Research analyst Eugenc Chua agrccd that it was fair, given the poor scntiment of the shipping industry. Hc was of thc opinion that Temasck had accepted the offer "[in the hope] that the deal would bring greater economic benefit to Singapore 7218 CMA CGM had pledged to "increase its commitment," and help reinforce Singapore's position as a leading maritime hub; the company intended to cstablish its regional hcad officc in Singapore, and sought to enhance Singapore's position in Asia.19 Vice-chairman Rudolphe Saad (son of CMA CGM's founder and chairman, Jacqucs Saad) said, Wc rccognizc thc strategic importancc of Singaporc as a kcy hub for the maritime industry and we are committed to reinforcing its regional leadership. At a time when the shipping industry is facing strong headwinds, scale is more critical than ever to capitalize on synergies and capture growth opportunitics whercvcr thcy arisc.20 9B17N007 Page 4 EFFECT ON THE BONDS Some of NOL's bonds had clauses that would be "triggered by the planned sale, allowing for potential early repayment or compensation."25 Such clauscs werc often inscrted in bonds that reccived implicit parental support of triplc A-rated (triplc A-ratcd cntitics wcrc unlikcly to default) majority stakcholdcrs likc Temasck The head of fixed income for Asia at Coutts Royal Bank of Scotland commented that"the confidence placed in government-owncd companics was somewhat over-cxtended. Investors who are looking to invest in these companies should look closer at the covenants of each issue, ensuring they are well protected on the downside should government support be removed."26 Of the four outstanding NOL bonds, two contained trigger clauses (the 2017 and 2019 bonds), while the other two (the 2020 and 2021 bonds) did not. The prices of all four bonds had suffered as events unfolded but not all to the same extent (see Exhibits 7 and 8). In addition, CMA CGM's offer also had an impact on its own bond (see Exhibits 7 and 8) ISSUES FACING INVESTORS In light of NOL's past financial performance, should NOL's shareholders accept CMA CGM's offer of S1.30 per share? Given the impact that the offer had on the value of the bonds, what should the bondholders ofNOL and CMA CGM do? 9B17N007 EXHIBIT 1: NEPTUNE ORIENT LINES: INCOME STATEMENTS, 2011-2015 (IN US$ '000) 5.382,596 7,025,575 8,831,193 9,511,631 9,210,704 Revenue 624,333 Revenue from logistics segment sold Revenue from container shipping retained 722,781 4,659,815 6,401,242 302,198 12,970 Cost of sales Gross profit Other gains net 5,029,914 6,723,377 8,247,254 8,988,2048,819,462 352,682 583,939 523,427 224,414 5,448 14,862 Miscellaneous Finance and investment income 31,376 6,653 6,805 Expenses Administrative IT Administrative non-IT Restructuring cost Finance Other operations -78,390 -153,795 -344,551 -397,556 -571,703 -693,956 149 8,437 -428,935 -45,240 -58,372 7,572 545 -15,837 131 -125,503 -138,954 -60,070 1.559 1,798 -217,700 -351,262 -20,502 -218,870-371.764 120,267 711,076-251,497 -75,272 -115,349 9,035 -55,834 Share of results of associated companies Share of results of joint ventures Loss before income tax Income tax expense Loss from continuing operations, net of tax Profit from discontinued operations, net of tax Net loss for the financial year 2,632 -360,773 -52,908 -44,997 929,946 -413,681 -71,968 -473,932 Equity holders of the company From continuing operations From discontinued operations -220,439-374.353 927,642 707,203-259,841 -76,298 -419,445 -478,188 Non-controlling interest From continuing operations From discontinued operations 2,589 5,755 8.344 3,873 4,330 oss per Basic, from continuing operations Basic, from discontinued operations Diluted, from continuing operations Diluted, from discontinued operations Source: NOL's past financial statements: Neptune Orient Lines Limited, Annual Report 2015, accessed March 1, 2016 https://www.nol.com.sgwps/wcm/connect/a655b534-c9d4-490e-bff0-531c3dcf1217/Full+Annual+Report+2015.pdf?MOD-AJPERES Neptune Orient Ls iited, "nvestor Relations," accessed https://www.nol.com.sg February 28, 2017, investorrelations/reportsandannouncements/annualreports 9B17N007 EXHIBIT 2: NEPTUNE ORIENT LINES: BALANCE SHEETS, 2011-2015 (IN US$ '000) 2013 2011 ASSETS CURRENT ASSETS Cash and cash equivalents Trade and other receivables Inventories at costs Derivative financial instruments Assets classified as held for sale Other current assets Total current assets NON-CURRENT ASSETS Investments in subsidiaries Investments in associated companies Investments in joint ventures Available-for-sale financial assets Property, plant, and equipment Investment property and land use rights Deferred charges Intangible assets Goodwill arising on consolidation Deferred income tax assets Derivative financial instruments Other non-current assets Total non-current assets TOTAL ASSETS 229,9071,225,771980,993896,978 227,562 520,4581,080,359 1,073,085 1,091,573 1,045,671 91,720 175,244 254,232 267,309 326,993 3,853 435 81,606 103,206 115,541 119,918 111,403 965,199 2,609,822 2,466,643 2,524,126 1,765,707 107,462 160,835 149,039 111,831 1,970 5,590,142 6,012,433 6,097,508 5,229,062 4,789,588 5,765 14.283 26,676 121,036 158,068 158,663 157,047 129,095 5,387 39,773 42,575 33,437 29,859 74,458 47,368 5,943,537 6,489,802 6,562,392 5,692,468 5,196,141 6,908,736 9,099,624 9,029,035 8,216,594 6,961,848 57,367 2013 2015 LIABILITIES Current Liabilities Trade and other payable Current income tax liabilities Borrowing:s Provisions Deferred income Derivative financial instruments Liabilities of group companies as held for sale Other current liabilities 854,661 1,178,233 1,252,421 ,247,627 429,246 12,585 1,274,431 114,627 422,095 43,459 2,448 615,095 40,378 599,119 29,983 205 11,625 251,812 1,703,463 2,228,622 2,311,967 2,157,593 2,125,715 226,949 140,532 252,480 Total current liabilities Non-current liabilities Borrowings Provisions Deferred income Deferred income tax liabilities Derivative financial instruments Other non-current liabilities 2,309,811 4,676,308 4,266,827 3,546,621 1,931,746 131,780 15,370 160,357 26,809 69,289 70,925 2,712,717 5,063,125 4,586,257 3,793,7412,183,949 4,416,180 7,291,747 6,898,224 5,951,3344,309,664 18,503 Total non-current liabilities TOTAL LIABILITIES EQUITY Share capital Treasury shares Other reserves Capital and reserves attributable to equity holders of the company (subtotal of Share Capital+ Treasury+Other reserves) Non-controlling interest TOTAL EQUITY TOTAL EQUITY LIABILITIES 1,840,260 1,834,3411,830,222 1,826,723 1,822,117 784,079 639,298 2,474,342 1,750,113 2,077,103 2,211,571 2,600,980 53,708 2,492,556 1,807,877 2,130,811 2,265,260 2,652,184 6,908,736 9,099,624 9.029,035 8,216,594 6,961,848 Note During financial year (FY) 2012, 1,754,757 new ordinary shares were issued under the NOL share option plan at $1.05, During FY 2011, 940,299 and 32,932 new ordinary shares were issued under the NOL share option plan at $1.05 and $2.10, respectively, During FY 2014, 3,789,763 new ordinary shares were issued under the NOL restricted share plan (RSP) 2010 and NOL performance share plan (PSP) 2010, During FY 2013, 2,582,419 new ordinary shares were issued under NOLRSP 2010 and NOL PSP 2010 During FY 2013, 379,674 new ordinary shares were issued under NOL share option plan at $1.05 Source: NOL's past financial statements: Neptune Orient Lines Limited, Annual Report 2015, and Neptune Orient Lines Limited, "Investor Relatons, acoessed February 28,2017, hitps:/www.nol.com.sgwpsportaolinvestorrelation Page 7 9B17N007 EXHIBIT 3: ASSUMPTIONS UNDERLYING DISCOUNTED CASH FLOW VALUATION The assumptions behind the pro-forma statements are listed below Assumptions regarding revenues a. Revenue from the logistics segment that had been carved out would be ignored. Only revenue from the container-shipping segment would be used in the valuation exercise Shipping volume was assumed to be 2,600,000 forty foot equivalent units (FEUs) in 2016, and to increase at a 3 per cent annual rate thereafter. Average Revenue/FEU was assumed to increase to US$2,000/FEU in 2016, and to US$2,286/FEU in 2017 (which was the rate during the 2008 financial crisis), and then increase at a 3 per cent annual rate until 2020 . Volume (000 FEU) 2,353 2,465 2,289 2,831 2,979 3,020 2,946 2,827 2,469 2,600 2,678 2,758 2,841 2,926 Average Revenue Revenue 000 USS$ ear r FEU (USS 2,740 3,033 2,286 2,787 2,500 2,509 2,318 2,264 1,887 2,000 2,286 2,355 2,425 2,498 6,447,220 7,476,34.5 5.232,654 7,889,997 7,447,500 7.577,180 6,828,828 6.400,328 4.659,003 2007 2008 2009 2010 2011 2012 2013 2014 2015 2016 projected 2017 proiected 2018 projected 2019 proiected 2020 projected 5,200,000 6.121,908 6,495,090 6,889,425 7.309,148 Other revenues, in the form of "Miscellaneous" and "Finance and Investment Income," were assumed to stay the same as 2015 b. Assumptions regarding costs Since NOL had been improving its cost efficiency, the gross margin was predicted to improve steadily from 8.5 per cent in 2016, to 9.5 per cent in 2017, and to 10 per cent in 2018, 2019, and 2020. This estimate was relatively conservative because the gross margin before the oversupply situation set in was 14 per cent. Other expenses mainly consisted of administrative (IT and non-IT), and finance expenses. Administrative (IT) expenses were expected to grow at a low rate of 2 per cent for the next five years, to adjust for inflation and increase in revenue. Administrative (non-IT) expenses were expected to reduce by 8 per cent and 4 per cent for the next two years as NOL strove to cut costs in this area, before growing at a positive 2 per cent rate. The yearly finance expense was equal to the cost of debt (2.5 per cent) multiplied by the total debt in the previous year. Other operating expenses were assumed to stay the same as 2015 . Assumptions regarding assets c. All current assets, except for "Assets of Group Companies as Held for Sale," were assumed to grow with revenue using 2015 as the base. It was assumed that "Assets of Group Companies as Held for Sale" would drop to zero in 2016 and thereafter . All non-current assets, except for "Investments in Associated Companies," "Investments in Joint Ventures," "Property, Plant, and Equipment," and "Goodwill Arising on Consoidation, were assumed to grow with revenue, using 2015 as the base. It was assumed that "Investments in Associated Companies, "Investments in Joint Ventures," and "Goodwill Arising on Consolidation" would stay the same. It was assumed that "Property, Plant, and Equipment" would grow at 5 per cent per year to take overcapacity into consideration Property, Plant, and Equipment (PPE) was assumed to depreciate at 7 per cent per year. Capital expenditure was the sum of the change in PPE and depreciation 9B17N007 Page 8 EXHIBIT 3 (CONTINUED) Change in net working capital was the difference in net working capital from one year to the next. Net working capital was defined as current assets not including cash, minus current liabilities d. Assumptions regarding equity All items under equity were assumed to stay the same except for "Retained Earnings.'" Retained earnings was equal to retained earnings from previous years plus profit/loss of the current year less dividends paid. Payout ratio was assumed to be zero in 2016, 20 per cent in 2017, 40 per cent in 2018, 60 per cent in 2019, and 80 per cent thereafter e, Ass umptions regarding liabilities All current liabilities, except for "Liabilities of Group Companies Classified as Held for Sale," were assumed to grow with revenue, using 2015 as the base. It was assumed that "Liabilities of Group Companies Classified as Held for Sale" would drop to zero in 2016 and thereafter All non-current liabilities, except for "Borrowings," were assumed to grow with revenue, using 2015 as the base Non-current borowings would be the plug f. Assumptions regarding terminal growth ratee Terminal growth rate was assumed to be 2.5 per cent. Source: Data on volume and average revenue from 2007 to 2015 obtained from NOL Corporate Presentations, 2007-2015, accessed March 1, 2016, https: www.nol.com.sg psiporalno investorrelations repor sandannouncements/quarter reports#navhomeibid: The growth rates are estimates based on NOL's past financial statements: Neptune Orient Lines Limited, Annual Report 2015, accessed March 1, 2016 https://www.nol.com.sgwpswcm/connectla655b534-c9d4-490e-bffO-531c3dc1217Full+Annual+Report+2015.pdf?MOD-AJPERES Neptune Orient Lines Limited, "Investor Relations," accessed February 28, 2017, https://www.nol.com.sg/wps/portalolinvestomelations 9B17N007 Page 9 EXHIBIT 4: ASSUMPTIONS UNDERLYING DIVIDEND DISCOUNT MODEL AND OTHER SELECTED FINANCIAL DATA 2,601,400,000 SG$1.23 SG$1.40US$1.00 US$2,882,362,000 2.50% 0.81 247% 6.89% 8.57% 10.768% 7.978% 17% NOL's ordinary shares outstanding NOL's stock price as at December 4, 2015 Exchange rate NOL's book debt as NOL's cost of debt NOL's equity beta 10-year Singapore Government bond yield Singapore equity risk premium* Asia/Middle East equity risk premium* Europe equity risk premium Americas equity risk premium* Singapore's tax rate at December 25, 2015 NOL's equity risk premium was computed as a weighted average of Singapore's equity risk premium and those of other markets in which NOL operated, with 50 per cent weight placed on Singapore, and the other 50 per cent divided across the geographical regions based on contribution to revenue, Asia/Middle East (29.1 per cent), Europe (16.2 per cent) and the Americas (54.8 per cent) NOL would start paying dividends from 2017 onwards, with dividend payout ratios of 0 per cent, 20 per cent, 40 per cent, 60 per cent, and 80 per cent for each year from 2016 to 2020, respectively. A terminal growth rate of 2.50 per cent was assumed 2016 2017 2019 2020 Dividend payout 0% 20% 40% 60% 80% Source: Equity risk premiums were downloaded from Bloomberg, Balance sheet data were obtained from NOL's past financial statements: Neptune Orient Lines Limited, Annual Report 2015, March 1, 2016, htpsJ/www.nol.com 531c3dcf1217/Ful Annual+Report+2015.pdf?MOD-AJPERES, Neptune Orient Lines Limited, "nvestor Relations," accessed February 28, 2017, 9B17NO EXHIBIT 5: KEY FINANCIAL FIGURES AND MARKET-COMPARABLE MULTIPLES OF SELECTED PUBLICLY TRADED FIRMS YangMing Marine Transport China OceanwideCMA CGM Hanjin Korea The Maersk Evergreern NOL Group Group Holdings Cor Grou Stock Exchange Share Price (on January 5 Singapore Copenhagen Taiwan Tawan orea on TWS8.25 HK$1.01 S$1.23 DKK89.40 TW$12.65 KRW34.65 Market Capitalization 27.611 89,207 42,898,00 707 13,525 5,383.60 352.68 4,866 4,989 4,236.16 189.55 -2.42 18,249 Emplovees Revenue (ttm Gross Profit (ttm) Operating Margin (%, ttm) Net Income (ttm) EPS (ttm, diluted) EVIRevenue EVIEBITDA PIE (ttm, forward) PIS (ttm) PIB (mrq****) 4,483.49 7.439.81 16,69 16,330,6 420.73 -0.54 60.53 5015.00 -218.87 38.80 -425.35 163.53 -0.03 685.78 2,663.73 33.1630 Total Cash and Equivalents 229.91 2,882.36 1.4262 3,507.00 12,325.00 6.9382 1.038.19 3,023.08 33.1630 500.82 5,928.06 1191.33 336.03 932.80 5,480.1 Exchange Rate in US$ (as of January 5, 2016) Indicative Stock Price in US$ (share price divided by exchange rate 7.7523 0.8624 1288.5186 0.3814 2.9085 0.2488 0.1303 Note: All balance sheet, income statement, and EPS data in US$ millions, but share prices are quoted in local currencies; *Adjusted closing share price on January 5, 2016 quoted in exchange currency. ^"Sales growth percentage versus same quarter ofthe previous year. ..'ttm = trailing 12 month. ^ ^^"mrq = most recent quarter Source: Bloomberg L.P., accessed January 5, 2016. The exchange rates are taken from the Exchange-Rates.org website, accessed January 5, 2016, www.exchange-rates.org 9B17N007 EXHIBIT 7: DETAILS OF NEPTUNE ORIENT LINES BONDS AND CMA CGM BONDS NOL NOL SG6Y06987482 NOL NOL Issuer Name CMA CGM SG7X44961531 XS1244815111 France 3/6/2015 15/1/2021 Corporate Bond/Note Senior Unsecured SG6U79981465 Singapore 26/4/2012 26/4/2017 SG6P73971303 Country of Domicile Issue Date Maturty Date 811/2012 811/2019 Corporate Bond/Note Senior Singapore Dollar 919/2010O 9/9/2020 Corporate Bond/Note Senior Unsecured Singapore Dollar 2216/2011 22/6/2021 Corporate BondiNote SeniOrU Singapore Dollar Security Type Corporate Bond/Note Seniority Level Issue Currenc Issue Amount Maturity Price 1% of p Offering Price % of par Face Value Senior Unsecured red Singapore Dollar 550,D00,000L g 400,000,000 300,000,000 280,000,000 300,000,000 100.00 98.87 1,000 7.750 250,000 4.250 250,000 250,000 4.650 250,000 Coupon Type Payment Frequency First Coupon Date Next Coupon Date Last Coupon Date Fixed Semi-Annual 9/3/2011 9/3/2016 9/3/2020 Seni-Annual 8,52013 8/5/2016 8/5/2019 Seni-AnnUa 27110 2012 2814/2016 emi-Annua 22112 2011 22/6/2016 Seni-Annua 15/1/2016 157/2016 157/2020 29/10 2016 2212/2020 -Coupon Step Callable Bond Feature -Change of Control CalCoupon Step*"* -Change of Control Call. Note: 'As of February 16, 2016; "Last coupon date refers to the last interest payment date prior to maturity; "If NOL did not repay the bonds within 60 days of a change in control the prevailing coupon rate would increase by 1.5%. "By giving not less than 30 days and not more than 60 days of irrevocable notice to bondholders, NOL might opt for early redemption of bonds at 100 per cent of the final redemption amount (par value) plus interest following the change of control. Source: FactSet, accessed February 16, 2016 i 9B17N007 Page 13 EXHIBIT 8: PRICES OF THE FOUR NOL BONDS AND ONE CMA CGM BOND (CMA CGM 2021) NOL 2017 NOL 2019 NOL 2020 | NOL 202 CMA CGM 202 1611/2015 92.50 92.27 92.27 92.27 1811/2015 1911/2015 20/11/2015 23112015 99.33 93.20 95.20 94.94 95.36 99.29 25112015 26112015 93.73 92.09 27 11 2015 30 112015 112/2015 2'12/2015 312/2015 412/2015 7'12/2015 8/12/2015 912/2015 10 122015 11/12/2015 141212015 1512/2015 16 12/2015 17 122015 1812/2015 21122015 221122015 231212015 2412/2015 25122015 28122015 29 122015 3012/2015 31/122015 98.88 94.83 94.02 92.07 92.08 89.25 93.76 98.97 87.9B 93.94 87.70 93.78 94,00 8,57 93.78 93.78 93.78 94.00 95.04 95.52 84.50 85,47 85.47 85.70 86.28 86.43 87.45 89.25 87.03 96.35 96.38 96.27 96.27 6.49 86.64 86.64 86.83 8742 87.42 87.78 95.95 95.94 85.28 85.28 411/2016 51112016 61/2016 7112016 8 1 2016 95.28 86.08 86.04 83.70 83.25 82.42 81.08 13 1/2016 1412016 151/2016 73.63 3.63 74.50 84.26 75.58 28 1/2016 77.22 77.47 12/2016 22/2016 2/2016 4:2/2016 52/2016 82:2016 S2/2016 10/2/2016 11/2/2016 12/2/2016 72.29 83.95 83.95 83.95 76.76 72.32 74.72 98.02 83.46 72.72 Souce: "Neptune Orent Lines, NOL 2017, Bond Factsheet accessed February 16 2016, www.bondsupermart factsheetSG6UT9981465, "Neptune Orient Lines, NOL 2019, Band Factsheet, accessed February 16, 2016, 482; "Neptune Orient Lines, NOL 2020," Bond Factsheet, acoessed February 17, 2016 www.bandsupermart.commainbond-infaband-factsheetSGTX44961531, Neptune Orient Lines, NOL 2021,"Bond Factsheet accessed February 17, 2016wwwbondsupematoommanbodrbbondfactsheetSG6P73971 300: MACGM 2021 ,'' FactSet, aocessed February 16, 2016. Page 2 9B17N007 recorded a net loss of USS741 million. This decline was followed by an amazing turnaround of its fortunes in 2010, which saw a nct profit for the company of USS461 million. Howcver, thc pcrformancc could not be sustained. NOL dipped into the red again, with losses of US$478 million in 2011, USS419 million in 2012, US$76 million in 2013,8 and US$260 million in 2014,9 for a total loss of US$1.233 billion ovcr this four-ycar pcriod. In licbruary 2015, NOL sold the profit-making APL for USS1.2 billion to concentrate on its container-shipping business,10 which had grown to become the 12th largest in the world In November 2015, it was announced that French shipping giant CMA CGM was in exclusive discussions to buy Singaporc icon NOL. With its high debt levcls and inability to rcturn to profitability, NOL had becrn looking for a buyer for months.12 CMA CGM was the world's third-largest container-shipping firm, and was privatcly owned by the billionaire Saad family. On the deadlinc to complete duc diligence, December 7, 2015, CMA CGM offcred S1.30 cash for cach of NOL sharcs.13 Thc company intended to takc NOL privatc and also planned to sell assets worth $1.4 billion from the merged entity to reduce debt.15 Temasek's head of portfolio management said We are supportive of this transaction [because] it presents NOL with an opportunity to join a leading playcr with an extensive global presence and solid operational track record. We also note and wclcome thc commitmcnt of CMA CGM to cnhancc Singaporc's position as a kcy maritimc hub, and grow Singapore s container throughput volumes The offer was subject to the approval of the American, European, and Chinese regulators.16 WHY SELL A NATIONAL ICON? According to the dircctor of rescarch at Drewry Shipping Consultants Limited, NOL was suffcring from overcapacity in the container-shipping industry and from falling freight rates: "The 2015 volume total is on coursc to be the lowest sincc 2009, whilc avcragc freight rates arc destincd to bc thc lowest in at lcast a decade. It's a toxic combination that the management has failed to arrest, and Temasek appears to have seen the writing on the wall that a turnaround is not imminent." NOL's deputy chief executive and chief financial officer in the 1990s felt that NOL might fetch a better price if it waitcd, "but thcrc's also thc worry that if thcy don't scll now, thcre may not bc a suitor later." Although the offer price was 0.96 times NOL's book value, Ocean Chinese Banking Corporation Investment Research analyst Eugenc Chua agrccd that it was fair, given the poor scntiment of the shipping industry. Hc was of thc opinion that Temasck had accepted the offer "[in the hope] that the deal would bring greater economic benefit to Singapore 7218 CMA CGM had pledged to "increase its commitment," and help reinforce Singapore's position as a leading maritime hub; the company intended to cstablish its regional hcad officc in Singapore, and sought to enhance Singapore's position in Asia.19 Vice-chairman Rudolphe Saad (son of CMA CGM's founder and chairman, Jacqucs Saad) said, Wc rccognizc thc strategic importancc of Singaporc as a kcy hub for the maritime industry and we are committed to reinforcing its regional leadership. At a time when the shipping industry is facing strong headwinds, scale is more critical than ever to capitalize on synergies and capture growth opportunitics whercvcr thcy arisc.20 9B17N007 Page 4 EFFECT ON THE BONDS Some of NOL's bonds had clauses that would be "triggered by the planned sale, allowing for potential early repayment or compensation."25 Such clauscs werc often inscrted in bonds that reccived implicit parental support of triplc A-rated (triplc A-ratcd cntitics wcrc unlikcly to default) majority stakcholdcrs likc Temasck The head of fixed income for Asia at Coutts Royal Bank of Scotland commented that"the confidence placed in government-owncd companics was somewhat over-cxtended. Investors who are looking to invest in these companies should look closer at the covenants of each issue, ensuring they are well protected on the downside should government support be removed."26 Of the four outstanding NOL bonds, two contained trigger clauses (the 2017 and 2019 bonds), while the other two (the 2020 and 2021 bonds) did not. The prices of all four bonds had suffered as events unfolded but not all to the same extent (see Exhibits 7 and 8). In addition, CMA CGM's offer also had an impact on its own bond (see Exhibits 7 and 8) ISSUES FACING INVESTORS In light of NOL's past financial performance, should NOL's shareholders accept CMA CGM's offer of S1.30 per share? Given the impact that the offer had on the value of the bonds, what should the bondholders ofNOL and CMA CGM do? 9B17N007 EXHIBIT 1: NEPTUNE ORIENT LINES: INCOME STATEMENTS, 2011-2015 (IN US$ '000) 5.382,596 7,025,575 8,831,193 9,511,631 9,210,704 Revenue 624,333 Revenue from logistics segment sold Revenue from container shipping retained 722,781 4,659,815 6,401,242 302,198 12,970 Cost of sales Gross profit Other gains net 5,029,914 6,723,377 8,247,254 8,988,2048,819,462 352,682 583,939 523,427 224,414 5,448 14,862 Miscellaneous Finance and investment income 31,376 6,653 6,805 Expenses Administrative IT Administrative non-IT Restructuring cost Finance Other operations -78,390 -153,795 -344,551 -397,556 -571,703 -693,956 149 8,437 -428,935 -45,240 -58,372 7,572 545 -15,837 131 -125,503 -138,954 -60,070 1.559 1,798 -217,700 -351,262 -20,502 -218,870-371.764 120,267 711,076-251,497 -75,272 -115,349 9,035 -55,834 Share of results of associated companies Share of results of joint ventures Loss before income tax Income tax expense Loss from continuing operations, net of tax Profit from discontinued operations, net of tax Net loss for the financial year 2,632 -360,773 -52,908 -44,997 929,946 -413,681 -71,968 -473,932 Equity holders of the company From continuing operations From discontinued operations -220,439-374.353 927,642 707,203-259,841 -76,298 -419,445 -478,188 Non-controlling interest From continuing operations From discontinued operations 2,589 5,755 8.344 3,873 4,330 oss per Basic, from continuing operations Basic, from discontinued operations Diluted, from continuing operations Diluted, from discontinued operations Source: NOL's past financial statements: Neptune Orient Lines Limited, Annual Report 2015, accessed March 1, 2016 https://www.nol.com.sgwps/wcm/connect/a655b534-c9d4-490e-bff0-531c3dcf1217/Full+Annual+Report+2015.pdf?MOD-AJPERES Neptune Orient Ls iited, "nvestor Relations," accessed https://www.nol.com.sg February 28, 2017, investorrelations/reportsandannouncements/annualreports 9B17N007 EXHIBIT 2: NEPTUNE ORIENT LINES: BALANCE SHEETS, 2011-2015 (IN US$ '000) 2013 2011 ASSETS CURRENT ASSETS Cash and cash equivalents Trade and other receivables Inventories at costs Derivative financial instruments Assets classified as held for sale Other current assets Total current assets NON-CURRENT ASSETS Investments in subsidiaries Investments in associated companies Investments in joint ventures Available-for-sale financial assets Property, plant, and equipment Investment property and land use rights Deferred charges Intangible assets Goodwill arising on consolidation Deferred income tax assets Derivative financial instruments Other non-current assets Total non-current assets TOTAL ASSETS 229,9071,225,771980,993896,978 227,562 520,4581,080,359 1,073,085 1,091,573 1,045,671 91,720 175,244 254,232 267,309 326,993 3,853 435 81,606 103,206 115,541 119,918 111,403 965,199 2,609,822 2,466,643 2,524,126 1,765,707 107,462 160,835 149,039 111,831 1,970 5,590,142 6,012,433 6,097,508 5,229,062 4,789,588 5,765 14.283 26,676 121,036 158,068 158,663 157,047 129,095 5,387 39,773 42,575 33,437 29,859 74,458 47,368 5,943,537 6,489,802 6,562,392 5,692,468 5,196,141 6,908,736 9,099,624 9,029,035 8,216,594 6,961,848 57,367 2013 2015 LIABILITIES Current Liabilities Trade and other payable Current income tax liabilities Borrowing:s Provisions Deferred income Derivative financial instruments Liabilities of group companies as held for sale Other current liabilities 854,661 1,178,233 1,252,421 ,247,627 429,246 12,585 1,274,431 114,627 422,095 43,459 2,448 615,095 40,378 599,119 29,983 205 11,625 251,812 1,703,463 2,228,622 2,311,967 2,157,593 2,125,715 226,949 140,532 252,480 Total current liabilities Non-current liabilities Borrowings Provisions Deferred income Deferred income tax liabilities Derivative financial instruments Other non-current liabilities 2,309,811 4,676,308 4,266,827 3,546,621 1,931,746 131,780 15,370 160,357 26,809 69,289 70,925 2,712,717 5,063,125 4,586,257 3,793,7412,183,949 4,416,180 7,291,747 6,898,224 5,951,3344,309,664 18,503 Total non-current liabilities TOTAL LIABILITIES EQUITY Share capital Treasury shares Other reserves Capital and reserves attributable to equity holders of the company (subtotal of Share Capital+ Treasury+Other reserves) Non-controlling interest TOTAL EQUITY TOTAL EQUITY LIABILITIES 1,840,260 1,834,3411,830,222 1,826,723 1,822,117 784,079 639,298 2,474,342 1,750,113 2,077,103 2,211,571 2,600,980 53,708 2,492,556 1,807,877 2,130,811 2,265,260 2,652,184 6,908,736 9,099,624 9.029,035 8,216,594 6,961,848 Note During financial year (FY) 2012, 1,754,757 new ordinary shares were issued under the NOL share option plan at $1.05, During FY 2011, 940,299 and 32,932 new ordinary shares were issued under the NOL share option plan at $1.05 and $2.10, respectively, During FY 2014, 3,789,763 new ordinary shares were issued under the NOL restricted share plan (RSP) 2010 and NOL performance share plan (PSP) 2010, During FY 2013, 2,582,419 new ordinary shares were issued under NOLRSP 2010 and NOL PSP 2010 During FY 2013, 379,674 new ordinary shares were issued under NOL share option plan at $1.05 Source: NOL's past financial statements: Neptune Orient Lines Limited, Annual Report 2015, and Neptune Orient Lines Limited, "Investor Relatons, acoessed February 28,2017, hitps:/www.nol.com.sgwpsportaolinvestorrelation Page 7 9B17N007 EXHIBIT 3: ASSUMPTIONS UNDERLYING DISCOUNTED CASH FLOW VALUATION The assumptions behind the pro-forma statements are listed below Assumptions regarding revenues a. Revenue from the logistics segment that had been carved out would be ignored. Only revenue from the container-shipping segment would be used in the valuation exercise Shipping volume was assumed to be 2,600,000 forty foot equivalent units (FEUs) in 2016, and to increase at a 3 per cent annual rate thereafter. Average Revenue/FEU was assumed to increase to US$2,000/FEU in 2016, and to US$2,286/FEU in 2017 (which was the rate during the 2008 financial crisis), and then increase at a 3 per cent annual rate until 2020 . Volume (000 FEU) 2,353 2,465 2,289 2,831 2,979 3,020 2,946 2,827 2,469 2,600 2,678 2,758 2,841 2,926 Average Revenue Revenue 000 USS$ ear r FEU (USS 2,740 3,033 2,286 2,787 2,500 2,509 2,318 2,264 1,887 2,000 2,286 2,355 2,425 2,498 6,447,220 7,476,34.5 5.232,654 7,889,997 7,447,500 7.577,180 6,828,828 6.400,328 4.659,003 2007 2008 2009 2010 2011 2012 2013 2014 2015 2016 projected 2017 proiected 2018 projected 2019 proiected 2020 projected 5,200,000 6.121,908 6,495,090 6,889,425 7.309,148 Other revenues, in the form of "Miscellaneous" and "Finance and Investment Income," were assumed to stay the same as 2015 b. Assumptions regarding costs Since NOL had been improving its cost efficiency, the gross margin was predicted to improve steadily from 8.5 per cent in 2016, to 9.5 per cent in 2017, and to 10 per cent in 2018, 2019, and 2020. This estimate was relatively conservative because the gross margin before the oversupply situation set in was 14 per cent. Other expenses mainly consisted of administrative (IT and non-IT), and finance expenses. Administrative (IT) expenses were expected to grow at a low rate of 2 per cent for the next five years, to adjust for inflation and increase in revenue. Administrative (non-IT) expenses were expected to reduce by 8 per cent and 4 per cent for the next two years as NOL strove to cut costs in this area, before growing at a positive 2 per cent rate. The yearly finance expense was equal to the cost of debt (2.5 per cent) multiplied by the total debt in the previous year. Other operating expenses were assumed to stay the same as 2015 . Assumptions regarding assets c. All current assets, except for "Assets of Group Companies as Held for Sale," were assumed to grow with revenue using 2015 as the base. It was assumed that "Assets of Group Companies as Held for Sale" would drop to zero in 2016 and thereafter . All non-current assets, except for "Investments in Associated Companies," "Investments in Joint Ventures," "Property, Plant, and Equipment," and "Goodwill Arising on Consoidation, were assumed to grow with revenue, using 2015 as the base. It was assumed that "Investments in Associated Companies, "Investments in Joint Ventures," and "Goodwill Arising on Consolidation" would stay the same. It was assumed that "Property, Plant, and Equipment" would grow at 5 per cent per year to take overcapacity into consideration Property, Plant, and Equipment (PPE) was assumed to depreciate at 7 per cent per year. Capital expenditure was the sum of the change in PPE and depreciation 9B17N007 Page 8 EXHIBIT 3 (CONTINUED) Change in net working capital was the difference in net working capital from one year to the next. Net working capital was defined as current assets not including cash, minus current liabilities d. Assumptions regarding equity All items under equity were assumed to stay the same except for "Retained Earnings.'" Retained earnings was equal to retained earnings from previous years plus profit/loss of the current year less dividends paid. Payout ratio was assumed to be zero in 2016, 20 per cent in 2017, 40 per cent in 2018, 60 per cent in 2019, and 80 per cent thereafter e, Ass umptions regarding liabilities All current liabilities, except for "Liabilities of Group Companies Classified as Held for Sale," were assumed to grow with revenue, using 2015 as the base. It was assumed that "Liabilities of Group Companies Classified as Held for Sale" would drop to zero in 2016 and thereafter All non-current liabilities, except for "Borrowings," were assumed to grow with revenue, using 2015 as the base Non-current borowings would be the plug f. Assumptions regarding terminal growth ratee Terminal growth rate was assumed to be 2.5 per cent. Source: Data on volume and average revenue from 2007 to 2015 obtained from NOL Corporate Presentations, 2007-2015, accessed March 1, 2016, https: www.nol.com.sg psiporalno investorrelations repor sandannouncements/quarter reports#navhomeibid: The growth rates are estimates based on NOL's past financial statements: Neptune Orient Lines Limited, Annual Report 2015, accessed March 1, 2016 https://www.nol.com.sgwpswcm/connectla655b534-c9d4-490e-bffO-531c3dc1217Full+Annual+Report+2015.pdf?MOD-AJPERES Neptune Orient Lines Limited, "Investor Relations," accessed February 28, 2017, https://www.nol.com.sg/wps/portalolinvestomelations 9B17N007 Page 9 EXHIBIT 4: ASSUMPTIONS UNDERLYING DIVIDEND DISCOUNT MODEL AND OTHER SELECTED FINANCIAL DATA 2,601,400,000 SG$1.23 SG$1.40US$1.00 US$2,882,362,000 2.50% 0.81 247% 6.89% 8.57% 10.768% 7.978% 17% NOL's ordinary shares outstanding NOL's stock price as at December 4, 2015 Exchange rate NOL's book debt as NOL's cost of debt NOL's equity beta 10-year Singapore Government bond yield Singapore equity risk premium* Asia/Middle East equity risk premium* Europe equity risk premium Americas equity risk premium* Singapore's tax rate at December 25, 2015 NOL's equity risk premium was computed as a weighted average of Singapore's equity risk premium and those of other markets in which NOL operated, with 50 per cent weight placed on Singapore, and the other 50 per cent divided across the geographical regions based on contribution to revenue, Asia/Middle East (29.1 per cent), Europe (16.2 per cent) and the Americas (54.8 per cent) NOL would start paying dividends from 2017 onwards, with dividend payout ratios of 0 per cent, 20 per cent, 40 per cent, 60 per cent, and 80 per cent for each year from 2016 to 2020, respectively. A terminal growth rate of 2.50 per cent was assumed 2016 2017 2019 2020 Dividend payout 0% 20% 40% 60% 80% Source: Equity risk premiums were downloaded from Bloomberg, Balance sheet data were obtained from NOL's past financial statements: Neptune Orient Lines Limited, Annual Report 2015, March 1, 2016, htpsJ/www.nol.com 531c3dcf1217/Ful Annual+Report+2015.pdf?MOD-AJPERES, Neptune Orient Lines Limited, "nvestor Relations," accessed February 28, 2017, 9B17NO EXHIBIT 5: KEY FINANCIAL FIGURES AND MARKET-COMPARABLE MULTIPLES OF SELECTED PUBLICLY TRADED FIRMS YangMing Marine Transport China OceanwideCMA CGM Hanjin Korea The Maersk Evergreern NOL Group Group Holdings Cor Grou Stock Exchange Share Price (on January 5 Singapore Copenhagen Taiwan Tawan orea on TWS8.25 HK$1.01 S$1.23 DKK89.40 TW$12.65 KRW34.65 Market Capitalization 27.611 89,207 42,898,00 707 13,525 5,383.60 352.68 4,866 4,989 4,236.16 189.55 -2.42 18,249 Emplovees Revenue (ttm Gross Profit (ttm) Operating Margin (%, ttm) Net Income (ttm) EPS (ttm, diluted) EVIRevenue EVIEBITDA PIE (ttm, forward) PIS (ttm) PIB (mrq****) 4,483.49 7.439.81 16,69 16,330,6 420.73 -0.54 60.53 5015.00 -218.87 38.80 -425.35 163.53 -0.03 685.78 2,663.73 33.1630 Total Cash and Equivalents 229.91 2,882.36 1.4262 3,507.00 12,325.00 6.9382 1.038.19 3,023.08 33.1630 500.82 5,928.06 1191.33 336.03 932.80 5,480.1 Exchange Rate in US$ (as of January 5, 2016) Indicative Stock Price in US$ (share price divided by exchange rate 7.7523 0.8624 1288.5186 0.3814 2.9085 0.2488 0.1303 Note: All balance sheet, income statement, and EPS data in US$ millions, but share prices are quoted in local currencies; *Adjusted closing share price on January 5, 2016 quoted in exchange currency. ^"Sales growth percentage versus same quarter ofthe previous year. ..'ttm = trailing 12 month. ^ ^^"mrq = most recent quarter Source: Bloomberg L.P., accessed January 5, 2016. The exchange rates are taken from the Exchange-Rates.org website, accessed January 5, 2016, www.exchange-rates.org 9B17N007 EXHIBIT 7: DETAILS OF NEPTUNE ORIENT LINES BONDS AND CMA CGM BONDS NOL NOL SG6Y06987482 NOL NOL Issuer Name CMA CGM SG7X44961531 XS1244815111 France 3/6/2015 15/1/2021 Corporate Bond/Note Senior Unsecured SG6U79981465 Singapore 26/4/2012 26/4/2017 SG6P73971303 Country of Domicile Issue Date Maturty Date 811/2012 811/2019 Corporate Bond/Note Senior Singapore Dollar 919/2010O 9/9/2020 Corporate Bond/Note Senior Unsecured Singapore Dollar 2216/2011 22/6/2021 Corporate BondiNote SeniOrU Singapore Dollar Security Type Corporate Bond/Note Seniority Level Issue Currenc Issue Amount Maturity Price 1% of p Offering Price % of par Face Value Senior Unsecured red Singapore Dollar 550,D00,000L g 400,000,000 300,000,000 280,000,000 300,000,000 100.00 98.87 1,000 7.750 250,000 4.250 250,000 250,000 4.650 250,000 Coupon Type Payment Frequency First Coupon Date Next Coupon Date Last Coupon Date Fixed Semi-Annual 9/3/2011 9/3/2016 9/3/2020 Seni-Annual 8,52013 8/5/2016 8/5/2019 Seni-AnnUa 27110 2012 2814/2016 emi-Annua 22112 2011 22/6/2016 Seni-Annua 15/1/2016 157/2016 157/2020 29/10 2016 2212/2020 -Coupon Step Callable Bond Feature -Change of Control CalCoupon Step*"* -Change of Control Call. Note: 'As of February 16, 2016; "Last coupon date refers to the last interest payment date prior to maturity; "If NOL did not repay the bonds within 60 days of a change in control the prevailing coupon rate would increase by 1.5%. "By giving not less than 30 days and not more than 60 days of irrevocable notice to bondholders, NOL might opt for early redemption of bonds at 100 per cent of the final redemption amount (par value) plus interest following the change of control. Source: FactSet, accessed February 16, 2016 i 9B17N007 Page 13 EXHIBIT 8: PRICES OF THE FOUR NOL BONDS AND ONE CMA CGM BOND (CMA CGM 2021) NOL 2017 NOL 2019 NOL 2020 | NOL 202 CMA CGM 202 1611/2015 92.50 92.27 92.27 92.27 1811/2015 1911/2015 20/11/2015 23112015 99.33 93.20 95.20 94.94 95.36 99.29 25112015 26112015 93.73 92.09 27 11 2015 30 112015 112/2015 2'12/2015 312/2015 412/2015 7'12/2015 8/12/2015 912/2015 10 122015 11/12/2015 141212015 1512/2015 16 12/2015 17 122015 1812/2015 21122015 221122015 231212015 2412/2015 25122015 28122015 29 122015 3012/2015 31/122015 98.88 94.83 94.02 92.07 92.08 89.25 93.76 98.97 87.9B 93.94 87.70 93.78 94,00 8,57 93.78 93.78 93.78 94.00 95.04 95.52 84.50 85,47 85.47 85.70 86.28 86.43 87.45 89.25 87.03 96.35 96.38 96.27 96.27 6.49 86.64 86.64 86.83 8742 87.42 87.78 95.95 95.94 85.28 85.28 411/2016 51112016 61/2016 7112016 8 1 2016 95.28 86.08 86.04 83.70 83.25 82.42 81.08 13 1/2016 1412016 151/2016 73.63 3.63 74.50 84.26 75.58 28 1/2016 77.22 77.47 12/2016 22/2016 2/2016 4:2/2016 52/2016 82:2016 S2/2016 10/2/2016 11/2/2016 12/2/2016 72.29 83.95 83.95 83.95 76.76 72.32 74.72 98.02 83.46 72.72 Souce: "Neptune Orent Lines, NOL 2017, Bond Factsheet accessed February 16 2016, www.bondsupermart factsheetSG6UT9981465, "Neptune Orient Lines, NOL 2019, Band Factsheet, accessed February 16, 2016, 482; "Neptune Orient Lines, NOL 2020," Bond Factsheet, acoessed February 17, 2016 www.bandsupermart.commainbond-infaband-factsheetSGTX44961531, Neptune Orient Lines, NOL 2021,"Bond Factsheet accessed February 17, 2016wwwbondsupematoommanbodrbbondfactsheetSG6P73971 300: MACGM 2021 ,'' FactSet, aocessed February 16, 2016
Step by Step Solution
There are 3 Steps involved in it
Step: 1

Get Instant Access to Expert-Tailored Solutions
See step-by-step solutions with expert insights and AI powered tools for academic success
Step: 2

Step: 3
Ace Your Homework with AI
Get the answers you need in no time with our AI-driven, step-by-step assistance
Get Started
Practical financial management
Authors: William r. Lasher
5th Edition
0324422636, 978-0324422634