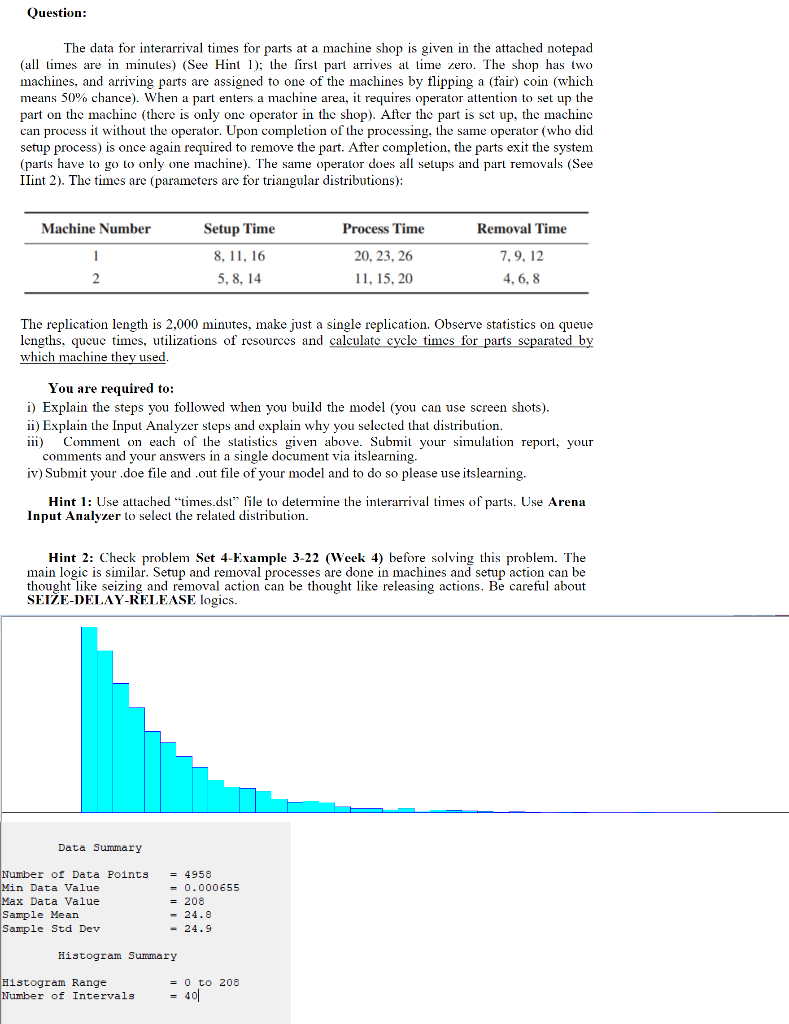
Question: The data for interarrival times for parts at a machine shop is given in the attached notepad (all times are in minutes) (See Hint 1); the first part arrives al time zero. The shop has two machines, and arriving parts are assigned to one of the machines by flipping a (fair) coin (which means 50% chance). When a part enters a machine area, it requires operator attention to set up the part on the machine (there is only one operator in the shop). After the part is set up, the machine can process it without the operator. Upon completion of the processing, the same operator (who did setup process) is once again required to remove the part. After completion, the parts exit the system (parts have to go to only one machine). The same operator does all setups and part removals (See Ilint 2). The times are (parameters are for triangular distributions): Machine Number Process Time Removal Time Setup Time 8, 11, 16 5, 8, 14 20, 23, 26 11, 15, 20 7,9,12 4, 6, 8 2 The replication length is 2,000 minutes, make just a single replication. Observe statistics on queue lengths, qucuc times, utilizations of resources and calculate cycle times for parts separated by which machine they used. You are required to: i) Explain the steps you followed when you build the model (you can use screen shots). ii) Explain the Input Analyzer steps and explain why you selected that distribution. 111) Comment on each of the statistics given above. Submit your simulation report, your comments and your answers in a single document via itslearning. iv) Submit your doe file and out file of your model and to do so please use itslearning. Hint 1: Use attached "times.dst" file to determine the interarrival times of parts. Use Arena Input Analyzer to select the related distribution Hint 2: Check problem Set 4-Example 3-22 (Week 4) before solving this problem. The main logic is similar. Setup and removal processes are done in machines and setup action can be thought like seizing and removal action can be thought like releasing actions. Be careful about SEIE-DELAY-RELEASE logics. Data Summary Number of Data Min Data Value Max Data Value Sample Mean Sample Std Dev = 4958 0.000655 = 208 - 24.8 - 24.9 Histogram Summary Histogram Range Number of Intervals = 0 to 208 = 400


