Answered step by step
Verified Expert Solution
Link Copied!

Question

1 Approved Answer

questions 5 and 6 only (rcode) **1) Explore the diamonds dataset inside ggplot2 package. How many rows are in diamonds? How many columns (variables)?** Answer:

questions 5 and 6 only (rcode) image text in transcribed
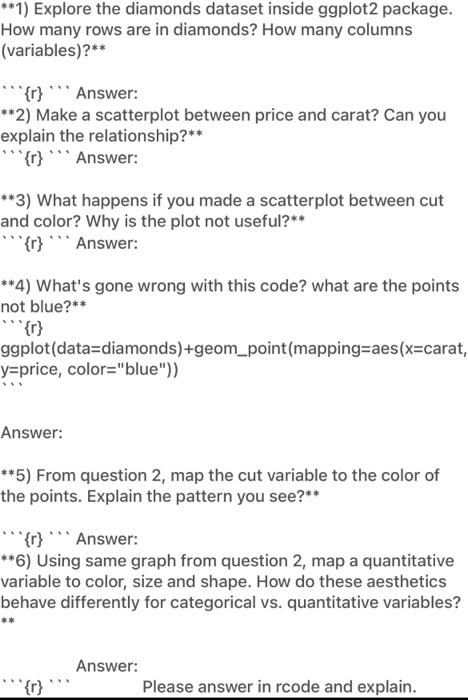
**1) Explore the diamonds dataset inside ggplot2 package. How many rows are in diamonds? How many columns (variables)?** Answer: **2) Make a scatterplot between price and carat? Can you explain the relationship?** **{r} * Answer: **3) What happens if you made a scatterplot between cut and color? Why is the plot not useful?** '{r} *Answer: **4) What's gone wrong with this code? what are the points not blue?** ggplot(data=diamonds)+geom_point( mapping=aes(x=carat, y=price, color="blue")) Answer: **5) From question 2, map the cut variable to the color of the points. Explain the pattern you see?** Answer: **6) Using same graph from question 2, map a quantitative variable to color, size and shape. How do these aesthetics behave differently for categorical vs. quantitative variables? Answer: Please answer in rcode and explain

Step by Step Solution

There are 3 Steps involved in it

Step: 1

blur-text-image

Get Instant Access to Expert-Tailored Solutions

See step-by-step solutions with expert insights and AI powered tools for academic success

Step: 2

blur-text-image_2

Step: 3

blur-text-image_3

Ace Your Homework with AI

Get the answers you need in no time with our AI-driven, step-by-step assistance

Get Started

Recommended Textbook for

Database Principles Programming And Performance

Authors: Patrick O'Neil, Elizabeth O'Neil

2nd Edition

1558605800, 978-1558605800

More Books

Students also viewed these Databases questions

Question

List the various types of predictive algorithms.

Answered: 1 week ago