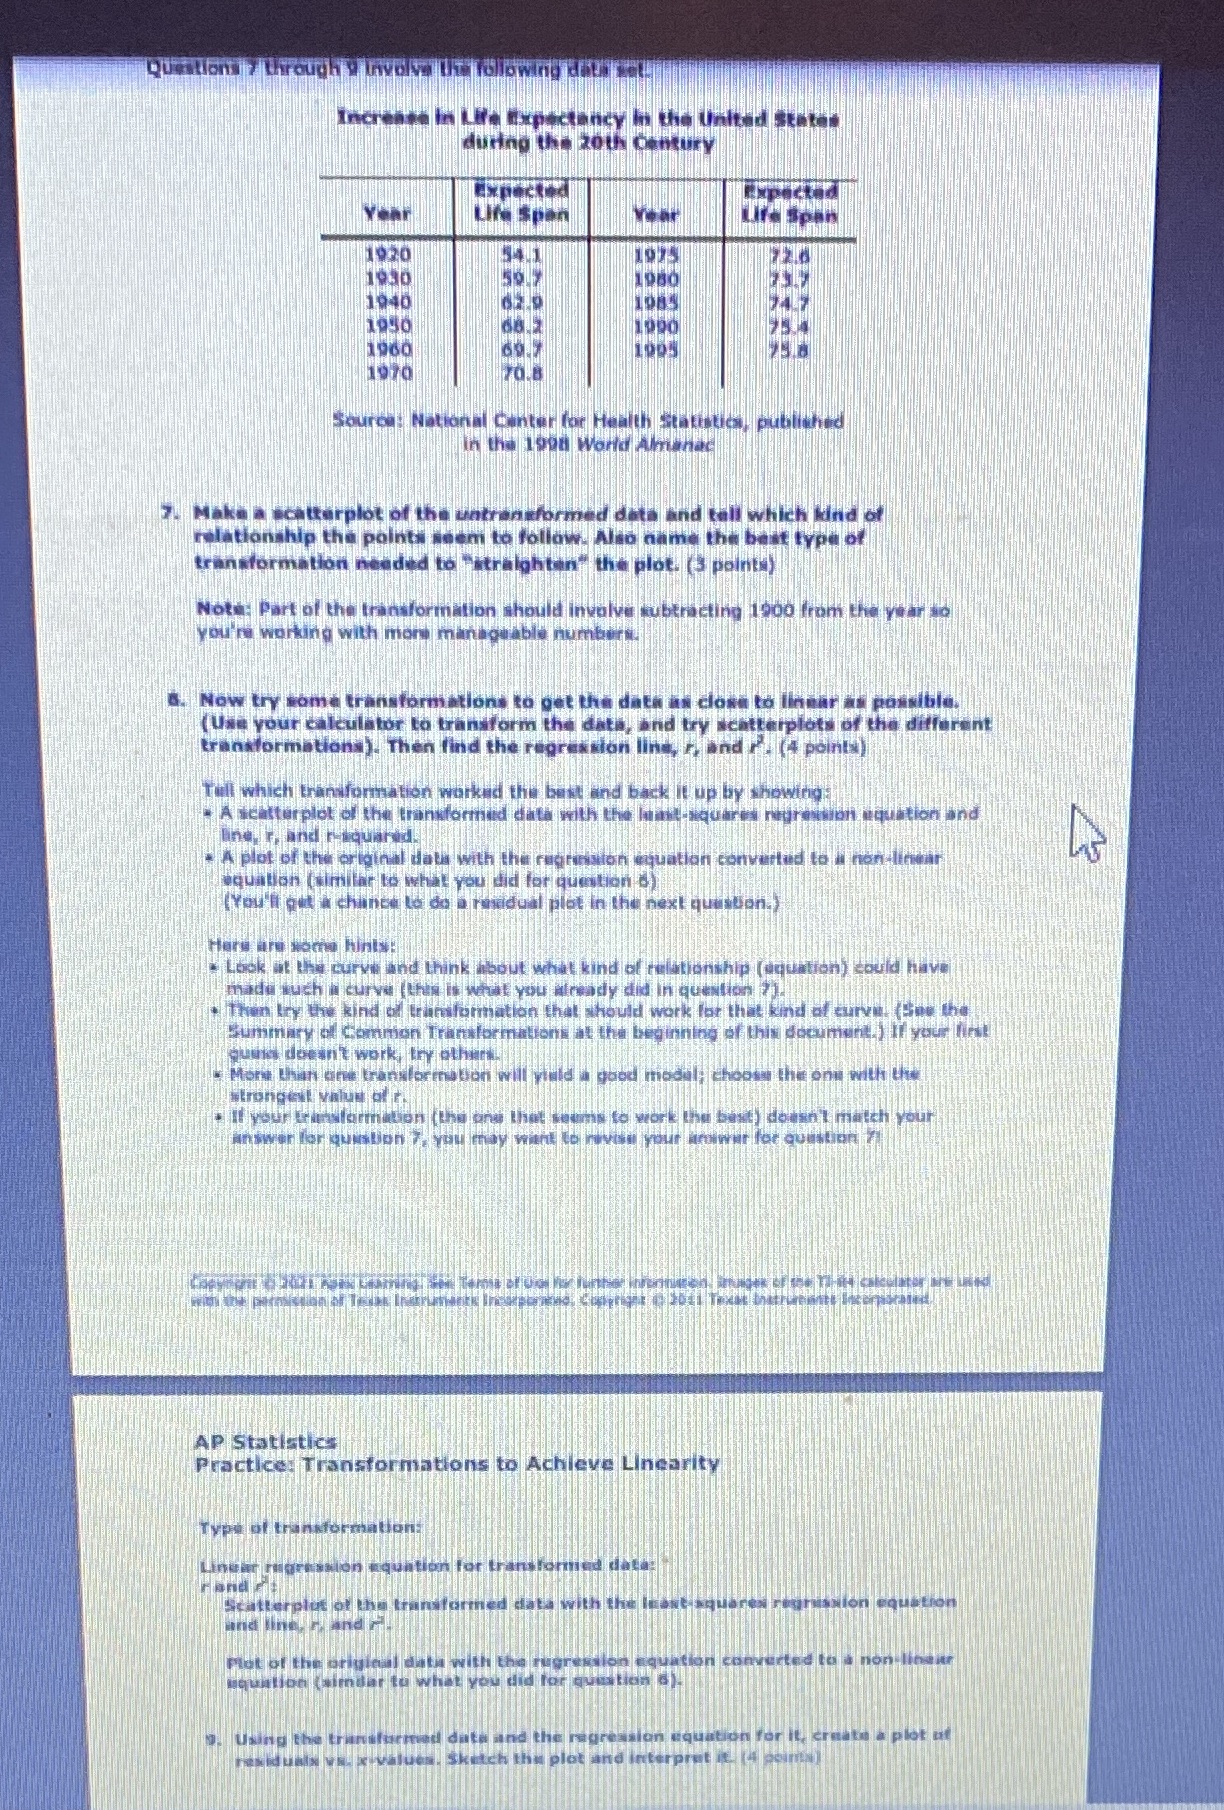
Questions ? through 9 Involve UT folowing data set Increase In Life Expectancy In the United States during the zoth century Expected Expected Year Life Span Ure Span 1920 1975 1930 1980 1940 1989 1950 1960 1970 Source: National Center for Health Statistics, published in the 1908 World Arenac 7. Make a scatterplot of the untransformed data and tall which kind of relationship the points seem to follow. Also name the best type of transformation needed to straighten" the plot. (S paints) Note: Part of the transformation should involve subtracting 1900 from the year so you're working with more manageable numbers Now try some transformations to get the dace as close to linear as possible. ( Use your calculator to transform the data, and try scatterplots of the different transformations). Then find the regression line, " and .'. (4 points) Tell which transformation worked the best and back it up by showing I A scatter plot of the transformed data with the han squares regression equation and line, r, and raquared. . A plot of the original dates with the regression equation converted to a non linear equation (similar to what you did for question s)]] (You'll get a chance to do a residual plot in the next question.) Here are some hints: Look at the curve and think about what kind of relationship (equation) could have made such a curve ( this is wist you already did in question?). Then try the kind of transformation that should work for that kind of curve! (See the Summary of Commion Transformations at the beginning of this document.) If your first gunia doesn't work, try athing More thiin one transformaban will make a good mogil; choose the one with the strongest value ofe. . your Custommation (the and that seems to vio hu best) doesn't match your answer for quinton 7. you may want to moved your ariwar for question ?! AP Statistics Practice: Transformations to Achieve Linearity Type of transformations Linear regression equation for transic Scatterplot of the transform and Ing. sandal Plot of the original data uquntion (aimdar to what Using the uon for it create a plot at


