Question
Queuing Exercise Lab Exercise #3 SCM 300 The purpose of this exercise is to discuss the situation facing a manager and help her determine how
Queuing Exercise Lab Exercise #3 SCM 300 The purpose of this exercise is to discuss the situation facing a manager and help her determine how many servers to use and what the characteristics of the system will be. Endeavor Communications, a long distance provider, is reevaluating its account management department for handling customer service questions and requests. During the 2:00 pm to 10:00pm time period, past data show that calls to the account management department occur at an average rate of one call every 6.5 minutes. A study of past service times indicate that the average time to process a caller's question/request is 4.3 minutes. Like other phone systems, when a call comes in and all the servers are busy, the caller hears a message telling them to hold until the next server is available. Top management at Endeavor Communications understands that the staffing decision involves the analysis of trade-offs. Increasing the number of servers will reduce the waiting times and increase the probability of immediate service at a higher cost with more idle time for the servers. Management has decided that the GOAL of the account management department is to immediately answer and service at least 90% of the incoming calls during the busiest time period of 2:00pm to 10:00pm. They have asked you to determine the staffing level that will help them meet this goal. Also, theyd like you to provide your own recommendations.
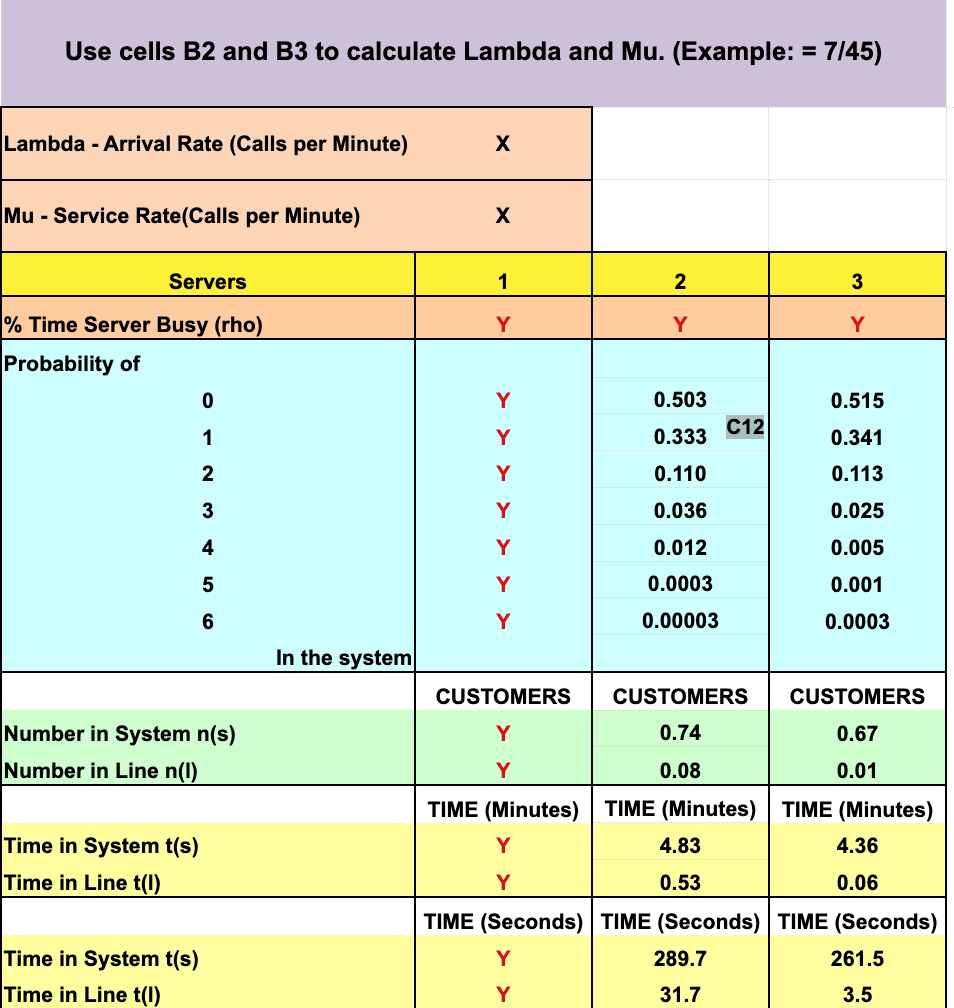
STEP 3 Questions using New Givens (1 point each) Lets hope you developed your excel spreadsheet. If you did, this section will take about 2 minutes. If you refused to use your spreadsheet, this could take a while. The numbers for the 2 and 3 server models are not tied to formulas in the file you were given, but the numbers in the single server model are tied to the formulas you have input. It should now be easy for you to input new arrival and service rates and then find the new outputs for the single server model.
26. Plug in these numbers into your spreadsheet: Arrival rate: 0.45 calls per minute Service rate: 0.98 calls per minute In a single-server model what is the average number of customers in the system?
27. Plug in these numbers into your spreadsheet: Arrival rate: 5.2 calls per minute Service rate: 6.05 calls per minute In a single-server model what is the average number of customers in the line?
28. Plug in these numbers into your spreadsheet: Arrival rate: 1.2 calls per minute Service rate: 2.1 calls per minute In a single-server model what is the probability of 3 customers in the system?
29. Plug in these numbers into your spreadsheet: Arrival rate: 0.155 calls per minute Service rate: 0.211 calls per minute In a single-server model what s the probability of 0 customers in the system?
30. Plug in these numbers into your spreadsheet: Arrival rate: 4.0 calls per minute Service rate: 4.4 calls per minute In a single-server model what is the average number of customers in the system?
Corresponding Excel File: 
Step by Step Solution
There are 3 Steps involved in it
Step: 1

Get Instant Access to Expert-Tailored Solutions
See step-by-step solutions with expert insights and AI powered tools for academic success
Step: 2

Step: 3

Ace Your Homework with AI
Get the answers you need in no time with our AI-driven, step-by-step assistance
Get Started


