

Answered step by step
Verified Expert Solution
Question
1 Approved Answer
R Code, please provide the necessary code based off of the provided lab/assignment. Question: Textbook/Assignment: 4.7.2 Logistic Regression Submit: The smallest p-value here is associated
R Code, please provide the necessary code based off of the provided lab/assignment.
Question:

Textbook/Assignment:
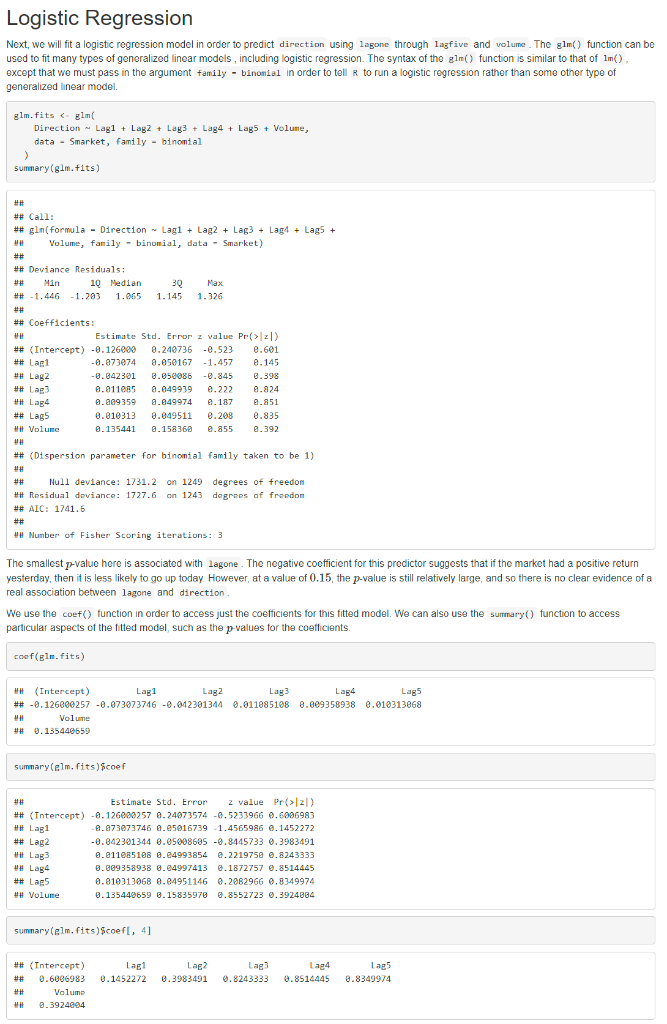
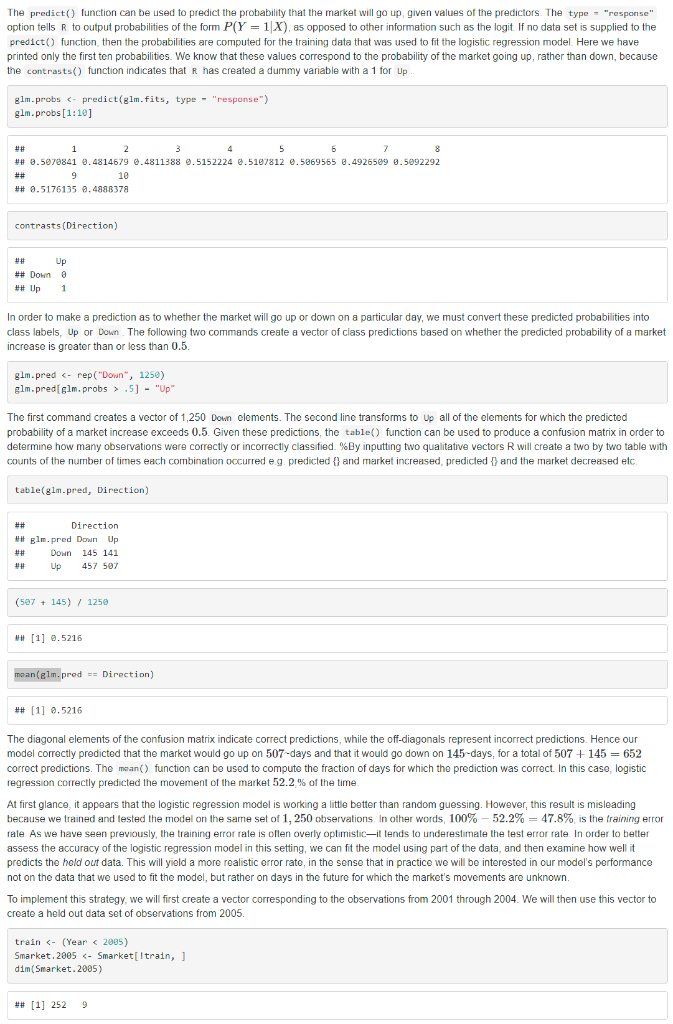
4.7.2 Logistic Regression Submit: The smallest p-value here is associated with lagone. The negative coefficient for this predictor suggests that if the market had a positive return yesterday, then it is less likely to go up today. However, at a value of 0.15, the p-value is still relatively large, and so there is no clear evidence of a real association between lagone and direction. We use the coef() function in order to access just the coefficients for this fitted model. We can also use the summary() function to access particular aspects of the fitted model, such as the p-values for the coeffcients. sumnary(elm,fits)scoef \#\# Estimate Std. Error 2 value Pr(>2) \#\# (Intercept) 0.1260002570.240735740.5233966.6006983 \#\# Lag1 0.0739737460.050167391.45659860.1452272 \#\# Lag2 .0423013440.050086050.84457330.3983491 \#H Lag3 0.0110651080.049938540.22197500.8243333 \#\# Lag4 0.0093589380.049974130.18727570.8514445 ##Lag50.0103130680.049511460.20829660.8349974 ##Volume0.1354406590.158359700.85527230.3924064 The predict() function can be used to predict the probability that the market will go up, given values of the predictors. The type = "response" option tells R to output probabilities of the form P(Y=1X), as opposed to other information such as the logit If no data set is supplied to the predict() function, then the probabilities are computed for the training data that was used to fit the logistic regression model Here we have printed only the first ten probabilities. We know that these values correspond to the probability of the market going up, rather than down, because the contrasts() function indicates that if has created a dummy variable with a 1 for Up. In order to make a prediction as to whether the market will go up or down on a particular day, we must convert these predicted probabilities into class labels, Up or Down. The following two commands create a vector of class predictions based on whether the predicted probability of a market increase is greater than or less than 0.5. glm.pred.5]"Up" The first command creates a vector of 1,250 Down elements. The second line transforms to Up all of the elements for which the predicted probability of a market increase exceeds 0.5. Given these predictions, the table() function can be used to produce a confusion matrix in order to determine how many observations were correctly or incorrectly classified. \%By inputting two qualitative vectors R will create a two by two table with counts of the number of times each combination occurred e.g. predicted \{\} and market increased, predicted \{\} and the market decreased etc. table(glm-pred, Direction) \begin{tabular}{lrrr} ## & \multicolumn{3}{c}{ Direction } \\ ## & Elm.pred & Down & Up \\ ## & Down & 145 & 141 \\ ## & Up & 457 & 597 \end{tabular} (597+145)/1250 [1] 0.5216 mon( glm.pred == Direction) # \# 1]0.5216 The diagonal elements of the confusion matrix indicate correct predictions, while the off-diagonals represent incorrect predictions. Hence our model correctly predicted that the market would go up on 507 -days and that it would go down on 145 -days, for a total of 507+145=652 correct predictions. The mean() function can be used to compute the fraction of days for which the prediction was correct. In this case, logistic regression correctly predicted the movement of the market 52.2% of the time. At first glance, it appears that the logistic regression model is working a little better than random guessing. However, this result is misleading because we trained and tested the model on the sarne set of 1,250 observations, In other words, 100%52.2%=47.8%, is the training error rate. As we have seen previously, the training error rate is oflen overly optimistic-it tends to underestimate the test error rate In order to better assess the accuracy of the logistic regression model in this setting, we can fit the model using part of the data, and then examine how well it predicts the hold out data. This will yield a more realistic error rate, in the sense that in practice we will be interested in our model's performance not on the data that we used to fit the model, but rather on days in the future for which the market's movements are unknown. To implement this strategy, we will first create a vector corresponding to the observations from 2001 through 2004 . We will then use this vector to create a held out data set of observations from 2005. train.5]
Step by Step Solution
There are 3 Steps involved in it
Step: 1

Get Instant Access to Expert-Tailored Solutions
See step-by-step solutions with expert insights and AI powered tools for academic success
Step: 2

Step: 3
Ace Your Homework with AI
Get the answers you need in no time with our AI-driven, step-by-step assistance
Get Started
Database And Expert Systems Applications 24th International Conference Dexa 2013 Prague Czech Republic August 2013 Proceedings Part 1 Lncs 8055
Authors: Hendrik Decker ,Lenka Lhotska ,Sebastian Link ,Josef Basl ,A Min Tjoa
2013 Edition
3642402844, 978-3642402845