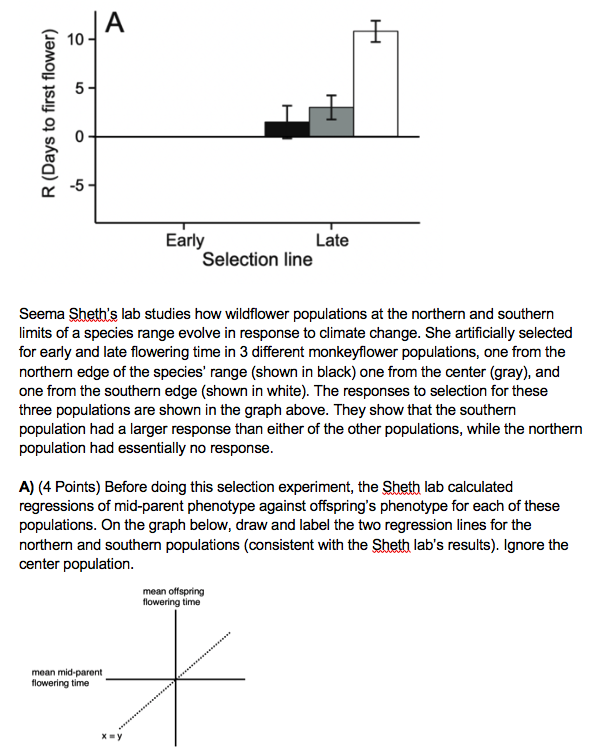
R (Days to first flower) Early Late Selection line Seema Sheth's lab studies how wildflower populations at the northern and southern limits of a species range evolve in response to climate change. She artificially selected for early and late flowering time in 3 different monkeyflower populations, one from the northern edge of the species' range (shown in black) one from the center (gray), and one from the southern edge (shown in white). The responses to selection for these three populations are shown in the graph above. They show that the southern population had a larger response than either of the other populations, while the northern population had essentially no response. A) (4 Points) Before doing this selection experiment, the Sheth lab calculated regressions of mid-parent phenotype against offspring's phenotype for each of these populations. On the graph below, draw and label the two regression lines for the northern and southern populations (consistent with the Sheth lab's results). Ignore the center population. mean offspring flowering time mean mid-parent flowering time R (Days to first flower) Early Late Selection line Seema Sheth's lab studies how wildflower populations at the northern and southern limits of a species range evolve in response to climate change. She artificially selected for early and late flowering time in 3 different monkeyflower populations, one from the northern edge of the species' range (shown in black) one from the center (gray), and one from the southern edge (shown in white). The responses to selection for these three populations are shown in the graph above. They show that the southern population had a larger response than either of the other populations, while the northern population had essentially no response. A) (4 Points) Before doing this selection experiment, the Sheth lab calculated regressions of mid-parent phenotype against offspring's phenotype for each of these populations. On the graph below, draw and label the two regression lines for the northern and southern populations (consistent with the Sheth lab's results). Ignore the center population. mean offspring flowering time mean mid-parent flowering time


