Answered step by step
Verified Expert Solution
Question
1 Approved Answer
R PROGRAMMING HELP ## 4. Conditional probability of death The plot above can be interpreted as the probability that a male or female will die
R PROGRAMMING HELP
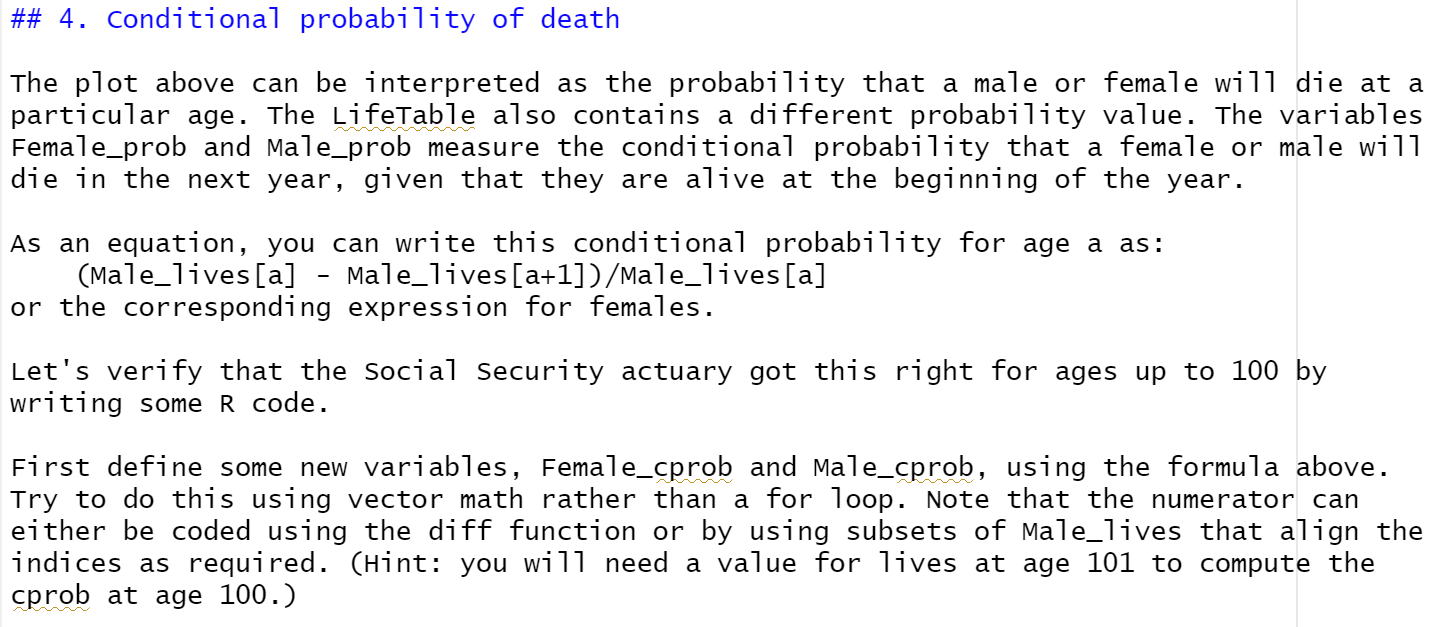
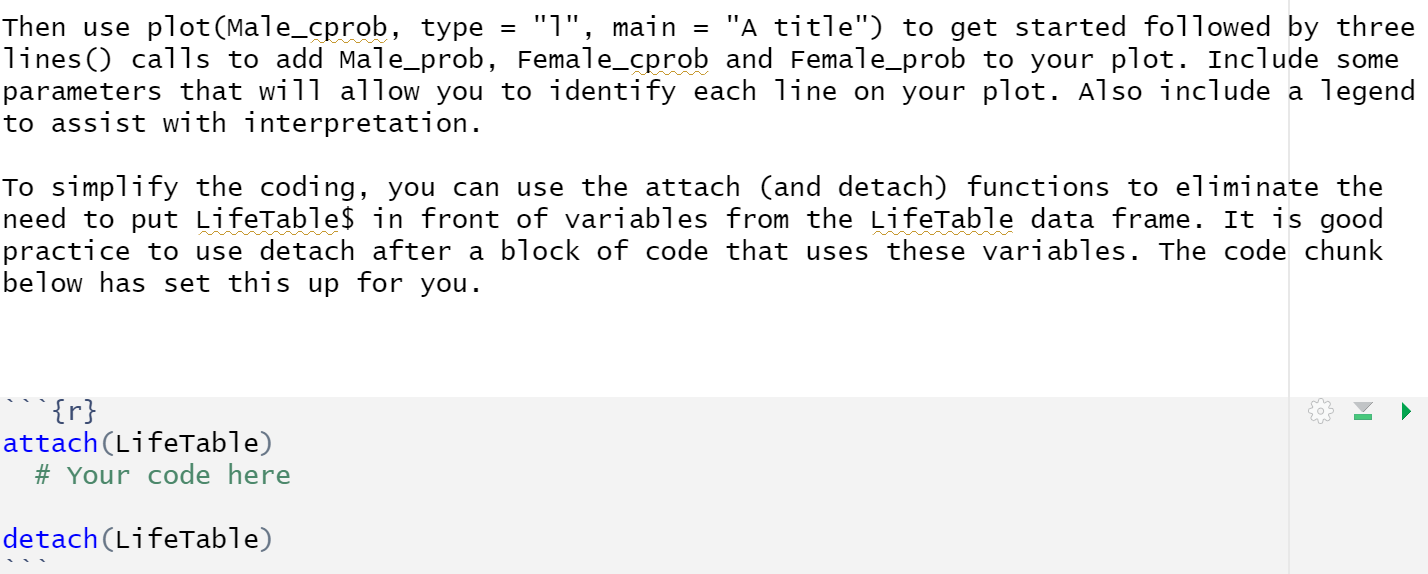
## 4. Conditional probability of death The plot above can be interpreted as the probability that a male or female will die at a particular age. The LifeTable also contains a different probability value. The variables Female_prob and Male_prob measure the conditional probability that a female or male will die in the next year, given that they are alive at the beginning of the year. As an equation, you can write this conditional probability for age a as: (Male_lives[a] - Male_lives [a+1])/Male_lives[a] or the corresponding expression for females. Let's verify that the Social Security actuary got this right for ages up to 100 by writing some R code. First define some new variables, Female_cprob and Male_cprob, using the formula above. Try to do this using vector math rather than a for loop. Note that the numerator can either be coded using the diff function or by using subsets of Male_lives that align the indices as required. (Hint: you will need a value for lives at age 101 to compute the cprob at age 100.) Then use plot(Male_cprob, type = "1", main = "A title") to get started followed by three lines () calls to add male_prob, Female_cprob and Female_prob to your plot. Include some parameters that will allow you to identify each line on your plot. Also include a legend to assist with interpretation. To simplify the coding, you can use the attach (and detach) functions to eliminate the need to put LifeTable$ in front of variables from the LifeTable data frame. It is good practice to use detach after a block of code that uses these variables. The code chunk below has set this up for you. {r} attach(LifeTable) # Your code here detach(LifeTable) ### Question 4: Do these plots suggest a significant difference between the calculated probabilities and the probabilities in the life tableStep by Step Solution
There are 3 Steps involved in it
Step: 1
Get Instant Access to Expert-Tailored Solutions
See step-by-step solutions with expert insights and AI powered tools for academic success
Step: 2
Step: 3
Ace Your Homework with AI
Get the answers you need in no time with our AI-driven, step-by-step assistance
Get Started