Answered step by step
Verified Expert Solution
Question
1 Approved Answer
randomly selected IRS telephone representatives. The proportions of correct answers were: 18,16,19,21,20,16,21,16,17,10,25,18,25,16,20,15,23,19,21, and 19. a. What are the upper and lower control limits for the
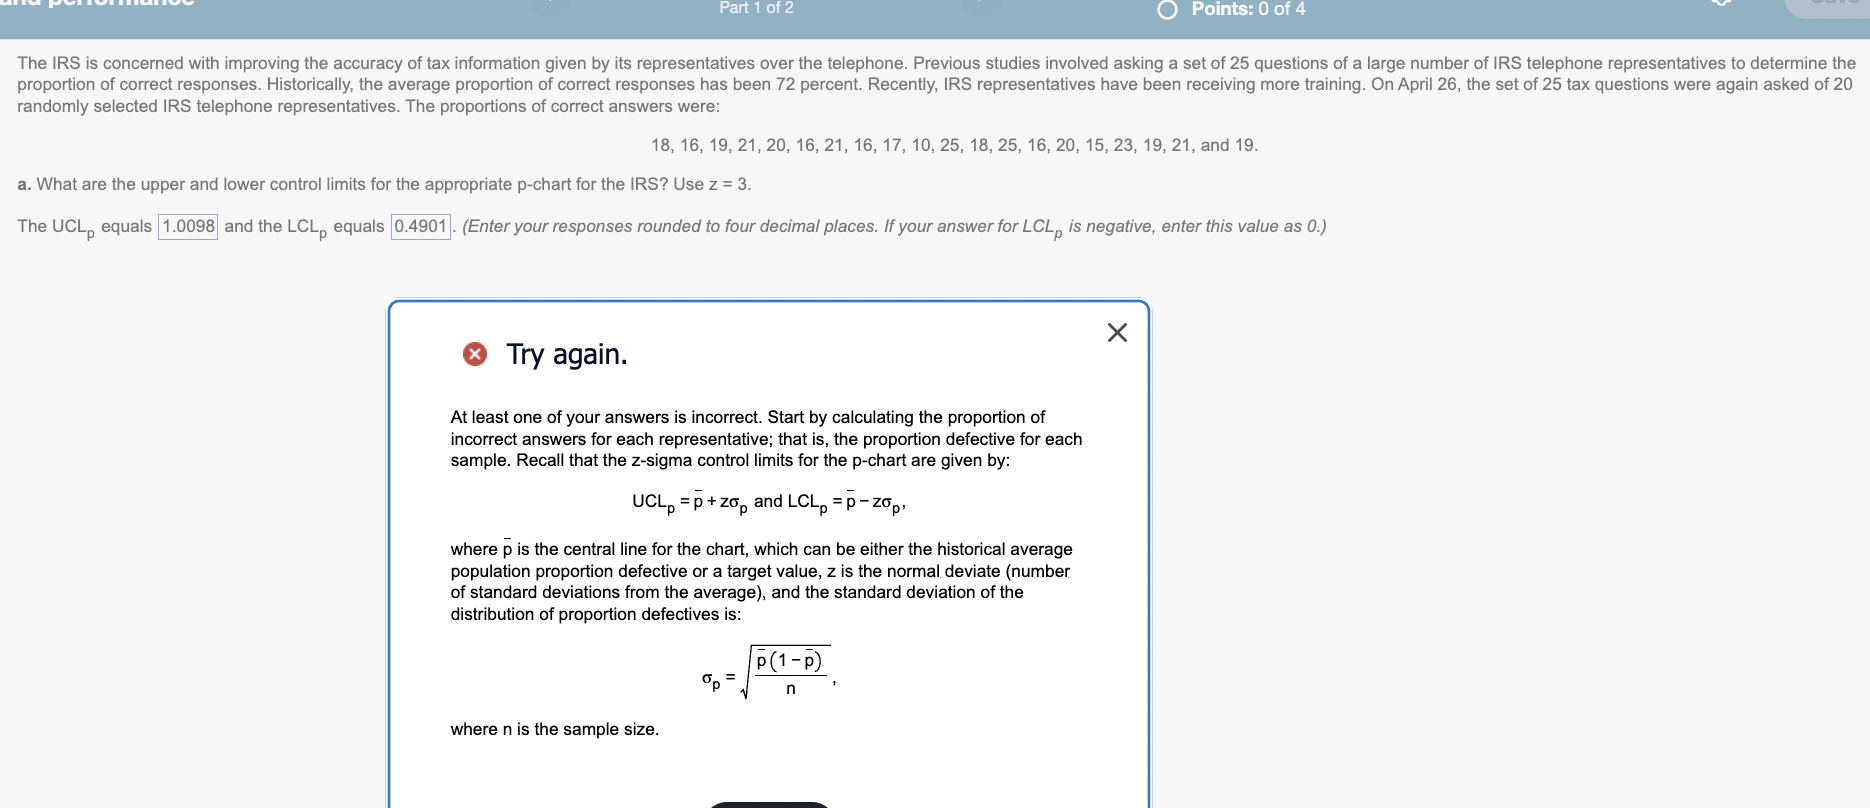
randomly selected IRS telephone representatives. The proportions of correct answers were: 18,16,19,21,20,16,21,16,17,10,25,18,25,16,20,15,23,19,21, and 19. a. What are the upper and lower control limits for the appropriate p-chart for the IRS? Use z=3. The UCLp equals and the LCLp equals 0.4901 . (Enter your responses rounded to four decimal places. If your answer for LCLp is negative, enter this value as 0. ) Try again. At least one of your answers is incorrect. Start by calculating the proportion of incorrect answers for each representative; that is, the proportion defective for each sample. Recall that the z-sigma control limits for the p-chart are given by: UCLp=p+zpandLCLp=pzp where p is the central line for the chart, which can be either the historical average population proportion defective or a target value, z is the normal deviate (number of standard deviations from the average), and the standard deviation of the distribution of proportion defectives is: p=np(1p), where n is the sample size
Step by Step Solution
There are 3 Steps involved in it
Step: 1
Get Instant Access to Expert-Tailored Solutions
See step-by-step solutions with expert insights and AI powered tools for academic success
Step: 2
Step: 3
Ace Your Homework with AI
Get the answers you need in no time with our AI-driven, step-by-step assistance
Get Started