Answered step by step
Verified Expert Solution
Question
1 Approved Answer
Range of inputs Significant inputs & assumptions March 31, June 30, Sensitivity March 31, 2023 2022 2023 Impact on fair value June 30, 2022

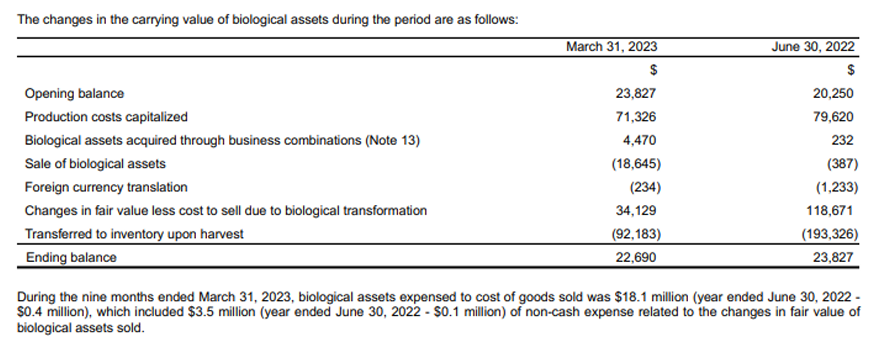
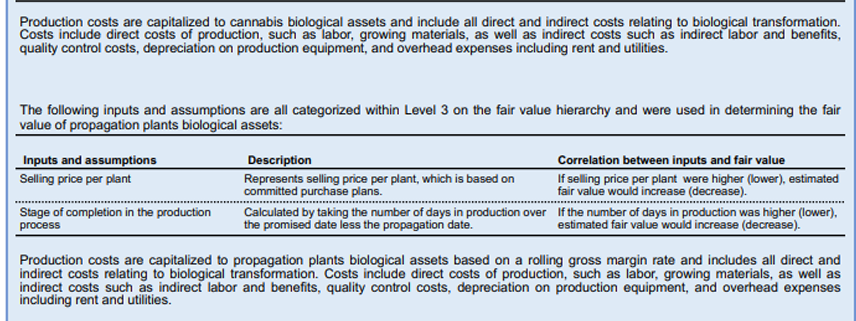
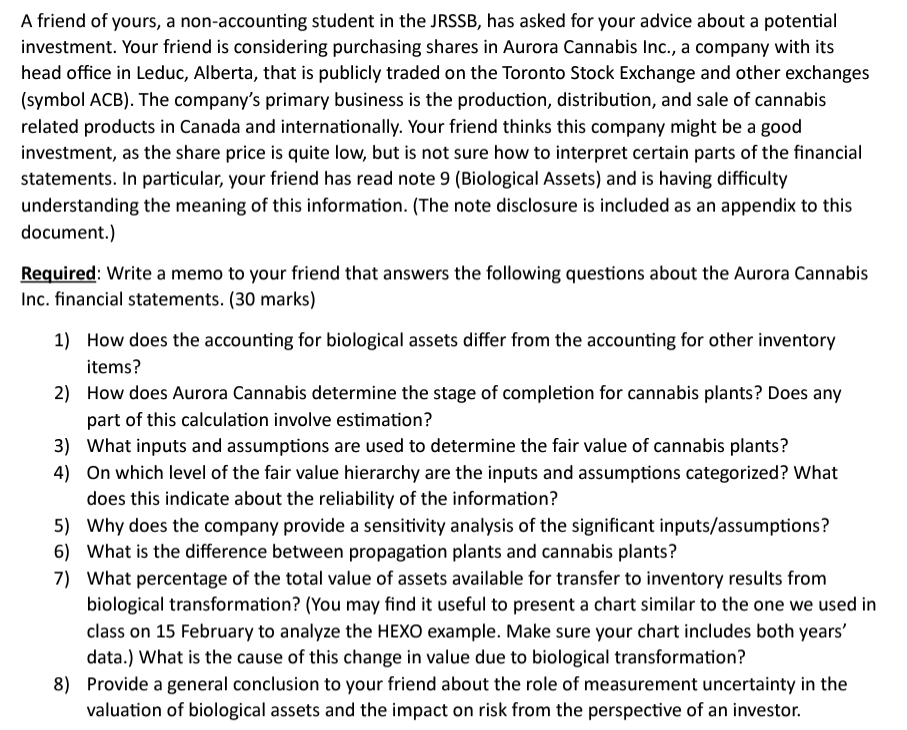
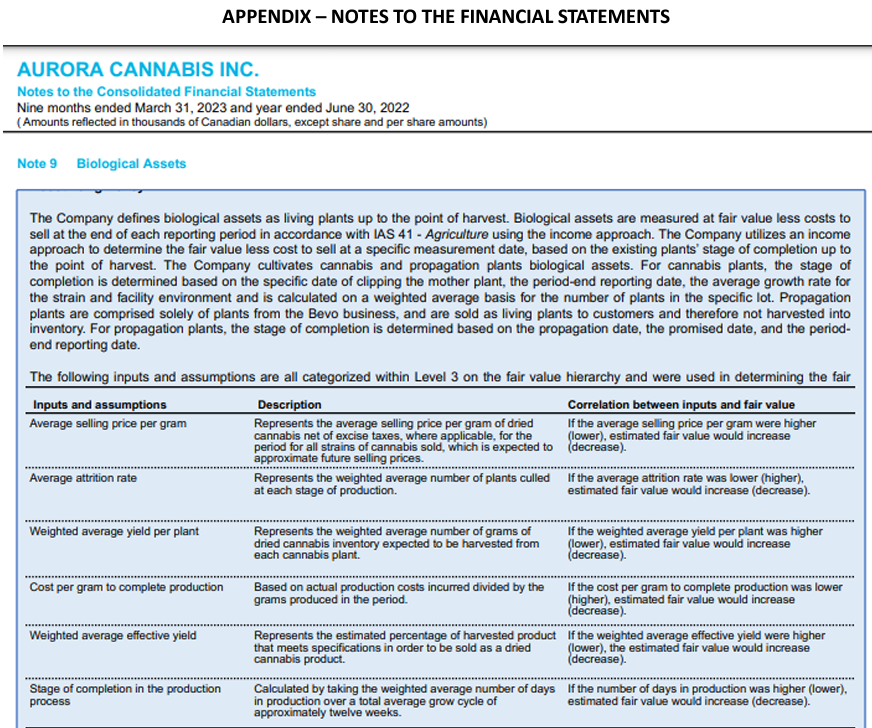
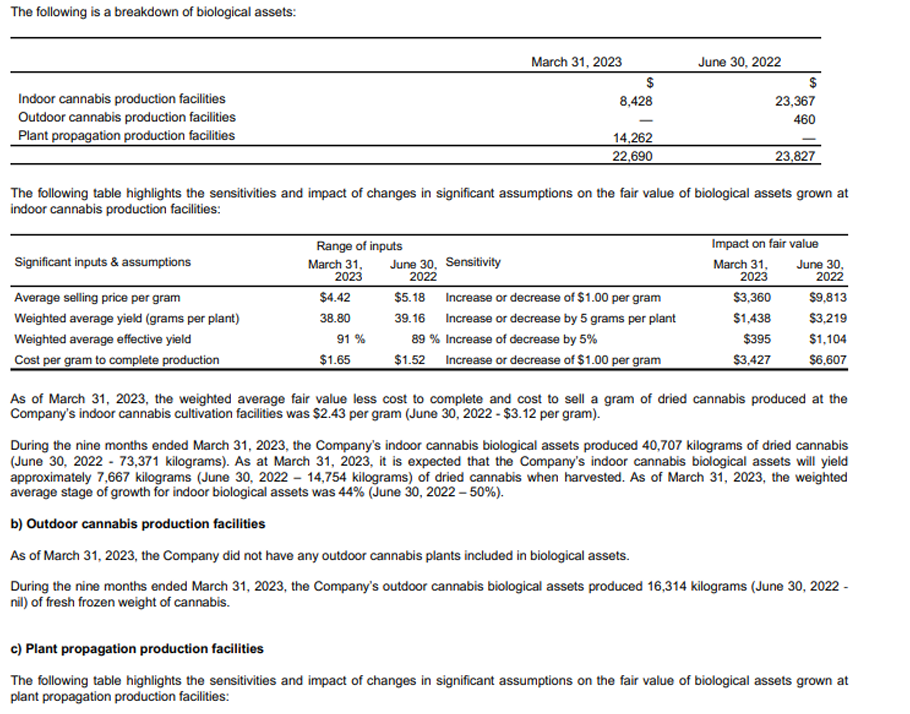
Range of inputs Significant inputs & assumptions March 31, June 30, Sensitivity March 31, 2023 2022 2023 Impact on fair value June 30, 2022 Average selling price per floral/bedding plant $ 7.58 n/a Increase or decrease by 10% $1,682 n/a Average stage of completion in the production process 56 % n/a Increase or decrease by 10% $2,295 n/a As of March 31, 2023, the weighted average fair value per propagation plant was $2.35 per plant. The Company's estimates are, by their nature, subject to change, and differences from the anticipated yield will be reflected in the gain or loss on biological assets in future periods. The changes in the carrying value of biological assets during the period are as follows: March 31, 2023 June 30, 2022 $ $ Opening balance 23,827 Production costs capitalized 71,326 20,250 79,620 Biological assets acquired through business combinations (Note 13) 4,470 232 Sale of biological assets (18,645) (387) Foreign currency translation (234) (1,233) Changes in fair value less cost to sell due to biological transformation 34,129 118,671 Transferred to inventory upon harvest Ending balance 23,827 During the nine months ended March 31, 2023, biological assets expensed to cost of goods sold was $18.1 million (year ended June 30, 2022 - $0.4 million), which included $3.5 million (year ended June 30, 2022 - $0.1 million) of non-cash expense related to the changes in fair value of biological assets sold. (92,183) (193,326) 22,690 Production costs are capitalized to cannabis biological assets and include all direct and indirect costs relating to biological transformation. Costs include direct costs of production, such as labor, growing materials, as well as indirect costs such as indirect labor and benefits, quality control costs, depreciation on production equipment, and overhead expenses including rent and utilities. The following inputs and assumptions are all categorized within Level 3 on the fair value hierarchy and were used in determining the fair value of propagation plants biological assets: Inputs and assumptions Selling price per plant Stage of completion in the production process Description Correlation between inputs and fair value If selling price per plant were higher (lower), estimated fair value would increase (decrease). Represents selling price per plant, which is based on committed purchase plans. Calculated by taking the number of days in production over If the number of days in production was higher (lower), the promised date less the propagation date. estimated fair value would increase (decrease). Production costs are capitalized to propagation plants biological assets based on a rolling gross margin rate and includes all direct and indirect costs relating to biological transformation. Costs include direct costs of production, such as labor, growing materials, as well as indirect costs such as indirect labor and benefits, quality control costs, depreciation on production equipment, and overhead expenses including rent and utilities. A friend of yours, a non-accounting student in the JRSSB, has asked for your advice about a potential investment. Your friend is considering purchasing shares in Aurora Cannabis Inc., a company with its head office in Leduc, Alberta, that is publicly traded on the Toronto Stock Exchange and other exchanges (symbol ACB). The company's primary business is the production, distribution, and sale of cannabis related products in Canada and internationally. Your friend thinks this company might be a good investment, as the share price is quite low, but is not sure how to interpret certain parts of the financial statements. In particular, your friend has read note 9 (Biological Assets) and is having difficulty understanding the meaning of this information. (The note disclosure is included as an appendix to this document.) Required: Write a memo to your friend that answers the following questions about the Aurora Cannabis Inc. financial statements. (30 marks) 1) How does the accounting for biological assets differ from the accounting for other inventory items? 2) How does Aurora Cannabis determine the stage of completion for cannabis plants? Does any part of this calculation involve estimation? 3) What inputs and assumptions are used to determine the fair value of cannabis plants? 4) On which level of the fair value hierarchy are the inputs and assumptions categorized? What does this indicate about the reliability of the information? 5) Why does the company provide a sensitivity analysis of the significant inputs/assumptions? 6) What is the difference between propagation plants and cannabis plants? 7) What percentage of the total value of assets available for transfer to inventory results from biological transformation? (You may find it useful to present a chart similar to the one we used in class on 15 February to analyze the HEXO example. Make sure your chart includes both years' data.) What is the cause of this change in value due to biological transformation? 8) Provide a general conclusion to your friend about the role of measurement uncertainty in the valuation of biological assets and the impact on risk from the perspective of an investor. APPENDIX - NOTES TO THE FINANCIAL STATEMENTS AURORA CANNABIS INC. Notes to the Consolidated Financial Statements Nine months ended March 31, 2023 and year ended June 30, 2022 (Amounts reflected in thousands of Canadian dollars, except share and per share amounts) Note 9 Biological Assets The Company defines biological assets as living plants up to the point of harvest. Biological assets are measured at fair value less costs to sell at the end of each reporting period in accordance with IAS 41 - Agriculture using the income approach. The Company utilizes an income approach to determine the fair value less cost to sell at a specific measurement date, based on the existing plants' stage of completion up to the point of harvest. The Company cultivates cannabis and propagation plants biological assets. For cannabis plants, the stage of completion is determined based on the specific date of clipping the mother plant, the period-end reporting date, the average growth rate for the strain and facility environment and is calculated on a weighted average basis for the number of plants in the specific lot. Propagation plants are comprised solely of plants from the Bevo business, and are sold as living plants to customers and therefore not harvested into inventory. For propagation plants, the stage of completion is determined based on the propagation date, the promised date, and the period- end reporting date. The following inputs and assumptions are all categorized within Level 3 on the fair value hierarchy and were used in determining the fair Inputs and assumptions Average selling price per gram Average attrition rate Weighted average yield per plant Cost per gram to complete production Weighted average effective yield Stage of completion in the production process Description Represents the average selling price per gram of dried cannabis net of excise taxes, where applicable, for the period for all strains of cannabis sold, which is expected to approximate future selling prices. Correlation between inputs and fair value If the average selling price per gram were higher (lower), estimated fair value would increase (decrease). Represents the weighted average number of plants culled If the average attrition rate was lower (higher), at each stage of production. estimated fair value would increase (decrease). Represents the weighted average number of grams of dried cannabis inventory expected to be harvested from each cannabis plant. Based on actual production costs incurred divided by the grams produced in the period. Represents the estimated percentage of harvested product that meets specifications in order to be sold as a dried cannabis product. If the weighted average yield per plant was higher (lower), estimated fair value would increase (decrease). If the cost per gram to complete production was lower (higher), estimated fair value would increase (decrease). If the weighted average effective yield were higher (lower), the estimated fair value would increase (decrease). Calculated by taking the weighted average number of days If the number of days in production was higher (lower), in production over a total average grow cycle of approximately twelve weeks. estimated fair value would increase (decrease). The following is a breakdown of biological assets: Indoor cannabis production facilities Outdoor cannabis production facilities March 31, 2023 June 30, 2022 $ $ 8,428 23,367 - 460 Plant propagation production facilities 14,262 22,690 23,827 The following table highlights the sensitivities and impact of changes in significant assumptions on the fair value of biological assets grown at indoor cannabis production facilities: Range of inputs Significant inputs & assumptions March 31, June 30, Sensitivity Impact on fair value March 31, June 30, 2023 2022 2023 2022 Average selling price per gram $4.42 $5.18 Weighted average yield (grams per plant) 38.80 39.16 Increase or decrease of $1.00 per gram Increase or decrease by 5 grams per plant $3,360 $9,813 $1,438 $3,219 Weighted average effective yield 91% 89 % Increase of decrease by 5% $395 $1,104 Cost per gram to complete production $1.65 $1.52 Increase or decrease of $1.00 per gram $3,427 $6,607 As of March 31, 2023, the weighted average fair value less cost to complete and cost to sell a gram of dried cannabis produced at the Company's indoor cannabis cultivation facilities was $2.43 per gram (June 30, 2022 - $3.12 per gram). During the nine months ended March 31, 2023, the Company's indoor cannabis biological assets produced 40,707 kilograms of dried cannabis (June 30, 2022 73,371 kilograms). As at March 31, 2023, it is expected that the Company's indoor cannabis biological assets will yield approximately 7,667 kilograms (June 30, 2022 - 14,754 kilograms) of dried cannabis when harvested. As of March 31, 2023, the weighted average stage of growth for indoor biological assets was 44% (June 30, 2022-50%). b) Outdoor cannabis production facilities As of March 31, 2023, the Company did not have any outdoor cannabis plants included in biological assets. During the nine months ended March 31, 2023, the Company's outdoor cannabis biological assets produced 16,314 kilograms (June 30, 2022 - nil) of fresh frozen weight of cannabis. c) Plant propagation production facilities The following table highlights the sensitivities and impact of changes in significant assumptions on the fair value of biological assets grown at plant propagation production facilities:
Step by Step Solution
There are 3 Steps involved in it
Step: 1

Get Instant Access to Expert-Tailored Solutions
See step-by-step solutions with expert insights and AI powered tools for academic success
Step: 2

Step: 3

Ace Your Homework with AI
Get the answers you need in no time with our AI-driven, step-by-step assistance
Get Started


