Question
Cook Asbestos Removal Company removes potentially toxic asbestos insulation from buildings. There has been a long-simmering dispute between the company's estimator and the work supervisors.
Cook Asbestos Removal Company removes potentially toxic asbestos insulation from buildings. There has been a long-simmering dispute between the company's estimator and the work supervisors. The on-site supervisors claim the estimators do not adequately distinguish between routine work, such as removing asbestos insulation around heating pipes in older homes, and nonroutine work, such as removing asbestos-contaminated ceiling plaster in industrial buildings. The on-site supervisors believe nonroutine work is far more expensive than routine work and should bear higher customer charges. The estimator sums up his position in this way: "My job is to measure the area to be cleared of asbestos. As directed by top management, I simply multiply the square footage by $2.50 to determine the bid price. Because our average cost is only $2.175 per square foot, that leaves enough cushion to take care of the additional costs of nonroutine work. Besides, it is difficult to know what is routine or not routine until you actually start tearing things apart."
To shed light on this controversy, the company gathered the following activity-based costing data:
| Activity Cost Pool | Activity Measure | Total Activity |
| Removing asbestos | Thousands of square feet | 800 thousand square feet |
| Estimating and job setup | Number of jobs | 500 jobs |
| Working on nonroutine jobs | Number of nonroutine jobs | 100 nonroutine jobs |
| Other (organization-sustaining costs and idle capacity costs) | None | |
| Note: The 100 nonroutine jobs are included in the total of 500 jobs. Both nonroutine jobs and routine jobs require estimating and setup. |
| Costs for the Year | |
| Wages and salaries | $300,000 |
| Disposal fees | 700,000 |
| Equipment depreciation | 90,000 |
| On-site supplies | 50,000 |
| Office expenses | 200,000 |
| Licensing and insurance | 400,000 |
| Total cost | $1,740,000 |
| Distribution of Resource Consumption Across Activities | |||||
| Removing | Estimating and | Working on | |||
| Asbestos | Job Setup | Nonroutine Jobs | Other | Total | |
| Wages and salaries | 50% | 10% | 30% | 10% | 100% |
| Disposal fees | 60% | 0% | 40% | 0% | 100% |
| Equipment depreciation | 40% | 5% | 20% | 35% | 100% |
| On-site supplies | 60% | 30% | 10% | 0% | 100% |
| Office expenses | 10% | 35% | 25% | 30% | 100% |
| Licensing and insurance | 30% | 0% | 50% | 20% | 100% |
Required:
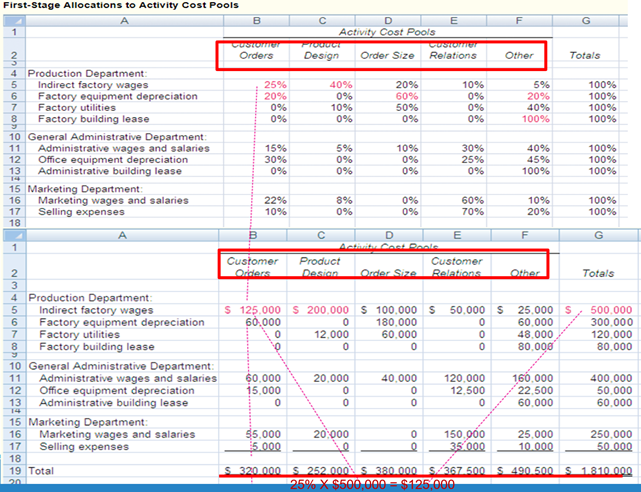
- Using Exhibit 1 as a guide, perform the first-stage allocation of costs to the activity cost pools.
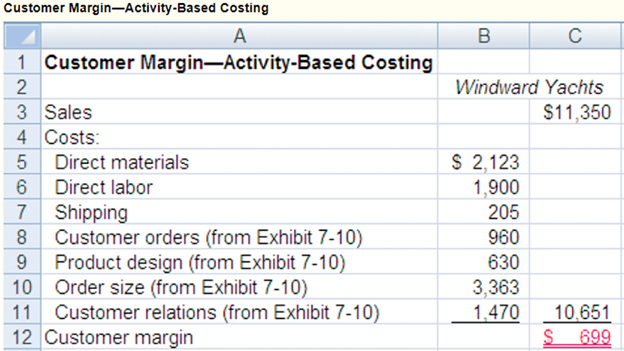
- Using Exhibit 2 as a guide, compute the activity rates for the activity cost pools.
- Calculate the total cost and the average cost per thousand square feet of each of the following jobs according to the activity-based costing system.
- A routine 1,000-square-foot asbestos removal job.
- A routine 2,000-square-foot asbestos removal job.
- A nonroutine 2,000-square-foot asbestos removal job.
- Given the results you obtained in (3) above, do you agree with the estimator that the company's present policy for bidding on jobs is adequate?


First-Stage Allocations to Activity Cost Pools A B D E G 1 3 4 Production Department: Activity Cost Pools Customer 7700001 Orders Design Order Size Customer Relations Other Totals 5 Indirect factory wages 25% 40% 20% 10% 5% 100% 6 Factory equipment depreciation 20% 0% 60% 0% 20% 100% 7 Factory utilities 0% 10% 50% 0% 40% 100% 8 Factory building lease 0% 0% 0% 0% 100% 100% 10 General Administrative Department: 11 Administrative wages and salaries 15% 5% 10% 30% 40% 100% 12 Office equipment depreciation 30% 0% 0% 25% 45% 100% 13 Administrative building lease 0% 0% 0% 0% 100% 100% 15 Marketing Department: 16 Marketing wages and salaries 22% 8% 0% 60% 10% 100% 17 Selling expenses 10% 0% 0% 70% 20% 100% 18 A A B C D E F G 1 Activity Cost Pools Customer Orders Product Design Order Size Customer Relations Other Totals 2 3 4 Production Department: 5 Indirect factory wages 6 Factory equipment depreciation 7 Factory utilities 8 9 11 12 13 Factory building lease 10 General Administrative Department: Administrative wages and salaries Office equipment depreciation Administrative building lease 14 15 Marketing Department: 16 Marketing wages and salaries 17 Selling expenses 18 19 Total 20 $ 125.000 $ 200.000 $ 100,000 $ 50,000 $ 25,000 $ 500,000 60,000 0 0 180,000 0 60,000 300,000 Q 12,000 0 60,000 0 48,000 120,000 0 0 80,000 80,000 60,000 20,000 40,000 120,000 160.000 400,000 15,000 0 0 0 12,500 22,500 50,000 0 0 0 60,000 60,000 55,000 5.000 20:000 0 0 150,000 Q 35.000 25,000 250,000 10.000 50.000 $ 320,000 $252.000 S 380.000 S/367.500 S 490.500 S 1.810.000 25% 6 X $500,000 $125,000
Step by Step Solution
There are 3 Steps involved in it
Step: 1

Get Instant Access to Expert-Tailored Solutions
See step-by-step solutions with expert insights and AI powered tools for academic success
Step: 2

Step: 3

Ace Your Homework with AI
Get the answers you need in no time with our AI-driven, step-by-step assistance
Get Started


